


CGKB News and events Management strategies
Risk identification and analysis


Contributors to this section: PhilRice, Philippines (Gabriel Romero); CGIAR IAU (John Fitzsimon); Bioversity-ILRI, Addis Ababa (Alexandra Jorge); IRRI, Los Baños, Philippines (Ruaraidh Sackville Hamilton, Renato Reaño); ILRI, Addis Ababa (Jean Hanson); CIMMYT, Mexico (Thomas Payne); IITA, Nigeria (Dominique Dumet); ICRISAT, Patancheru, India (Hari D Upadhyaya); NCGR USDA-ARS, Oregon, USA (Barbara Reed); NCGRP USDA-ARS, Fort Collins, Colorado (Dave Ellis).
 |
|
Click on the image above for the generic risk assessment tool for |
|
|
|
Click on the image above for the generic risk assessment tool for clonal crops |
Taking into account information gathered in Risk assessment, an inventory of relevant risks to the genebank operations should be made. The major risks to genebanks are germplasm mis-identification, unstable storage facilities and insufficient funding support. An extensive list of risks gathered in documents from five CGIAR Centers and genebank of the Philippine Rice Research Institute, discussions with four USDA-ARS conservation and database management sites and information contained in various genebank management literature has been compiled and is set out in Table 1 for seeds and Table 2 for clonal materials.
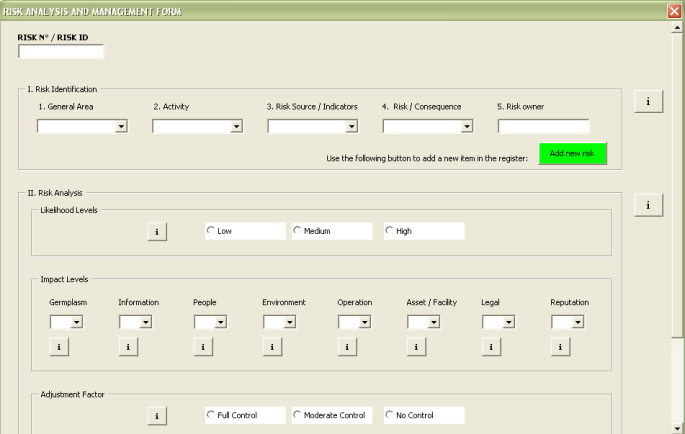
The generic risk assessment tool for seed crops and clonal crops serves as the input forms for risks and other information required for a particular genebank. For this step, the general area of genebank operations and specific activity and the risk source/indicator should be identified. These can be selected from those listed in Table 1a and Table 2a, but need not be limited to these.
Also, as part of the risk identification step, risk ownership should be identified. This means identifying the organizational unit or manager who is responsible for monitoring, analyzing, evaluating the risk and implementing the controls or contingency plans associated with the risk. Most of the risks identified will be managed by managers and staff within the genebank or larger Genetic Resources Unit (or equivalent) in which the genebank staff are organizationally located. Others will be managed in partnership with other units within the Centres. The suggested partner units are identified in Table 1b and Table 2b.
Risk analysis covers both the potential impact (or consequence) of the identified risks, and their likelihood (probability). In the case of likelihood, an intrinsic likelihood was first considered, taking into account the nature of the risk and its probability in the absence of controls or other mitigations, and then adjusted for mitigating controls that were confirmed as being in place. To develop a quantitative risk assessment, a point system for the scales or levels of the likelihood and impact of risks was devised in the context of genebanking operations. The point system was simplified and, consistent with the approach taken by many CGIAR Centres for their enterprise wide risk management frameworks; a 3-point scale was proposed: 1 point (Low), 2 points (Medium), and 3 points (High) for both likelihood and impact.
Intrinsic likelihood
The likelihood levels table below provides suggested definitions for the likelihood scale. These likelihood levels can be amended to suit a particular genebank’s conditions. Should a genebank wish to initially simplify this further, a 2-point scale could be adopted: 1 point (Low) and 2 points (High) for both likelihood and impact.
Likelihood levels
|
Low (1) |
Very unlikely to practically impossible; 0-10% of the time. (Example: one or no occurrence in ten years.) |
|
Medium (2) |
Occasional; 20-60% of the time. (Example: two or six occurrences in ten years.) |
|
High (3) |
Moderately frequent to frequent; Above 60% of the time. (Example: seven and more occurrences in ten years.) |
Impact
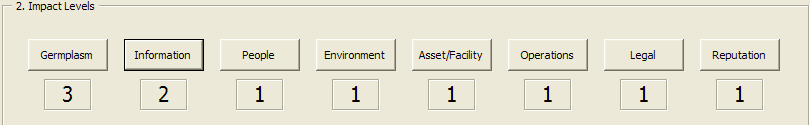
Since risks can impact multiple aspects of genebanking, namely: germplasm, information, people, environment, asset/facility, operations, legal and reputation; quantitative cut-offs can be set for each area. For initial implementation, to keep the process simpler, impact of legal and reputation risks may be excluded. Table 3 sets out suggested definitions for the impact levels taking into account these multiple aspects. There will be risks that impact multiple aspects per category. The highest risk level in any aspect should be the one selected for each category.
|
Example 1: For category germplasm, a certain risk poses high (3) impact on viability, medium (2) on diversity and low (1) on availability, then the score for this category is 3. However, if at least two of the aspects have medium (2) impact, then the category as a whole gets the highest (3) score for impact. For regular implementation of this rating scheme, low is loss of seed viability by 0-1%, medium by 2-5% and high by above 5% per year. For an initial, simpler implementation, low could be loss of seed viability by 0-1%, and high could be loss by more than 1% per year. The total impact score can then be the sum of the scores in all the aspects considered. Note that 1 point should be given to any of the above mentioned aspects that are not affected by the risk as a normalization step for computing for relative weights of the risks. |
One suggested rating scheme, taking account of the multiple aspects reflected in Table 3, is to award an overall Low impact rating where there is an aggregate total of 8 points, a Medium rating where this a total of 9 points (with 2 points in at least one area) and a High rating where this is a total of 10 points (with 3 points in at least one area) under High impact. Hence, risks with an impact score of 2 points each (Medium) in two or more areas will have a total greater than 9 points and subsequently fall under High impact.
|
Example 2: If the risk indicator is “Misidentification of germplasm” during collecting, the impact may be assessed in the various categories from germplasm to reputation using the generic risk assessment tool for seed crops and clonal crops, as follows:
Germplasm – 3, if the misidentified germplasm is in terms of diversity “recoverable from only 1 to 3 sources to total loss.” This can happen if the material is grown only in one location that is undergoing conversion or becoming inaccessible. Information – 2, if this risk indicator results in “6-10% gap in data or 6-10% loss in data accuracy or 30-90% usefulness”. People, Environment, Operation, Asset/Facility, Legal and Reputation - 1, since this risk source does not affect any aspect in these categories. In this case the total score comes to 11, and so the risk is rated “High” impact. The above rating scheme can be changed to more accurately reflect local conditions and standards. |
Adjustment Factor
Existing controls or strategies to mitigate the risks were identified and described. These controls or other mitigations can be in three areas: personnel; facility and equipment; and procedure/methodology. The areas of control table below provides further information on these three areas.
Areas of control
|
Personnel |
Staff performing the activity receives competency through training or actual experience. Dedication and enthusiasm through adequate compensation. |
|
Facility and |
Machine or equipment used is of correct specification, capability and good condition, and is available. |
|
Procedure |
Appropriate procedure developed and communicated on conduct of activity. |
Table 1c and Table 2c provide examples of controls, classified according to these three areas, for the risks listed in the tables. As illustrated in these Tables, there are risks that need controls in all three areas, while some risks can be addressed in only one or two areas.
The documented references to these controls should be linked to the supporting documents such as policies and procedures, and the evidence(s)/proof(s) that the control measures described are being implemented should be checked through analysis of operating measurements and periodic audits.
Based on adequacy of controls, the risk likelihood rating may be adjusted. The adjustment factor table below presents a scheme for this purpose. For a more simple, initial adoption, Moderate to Full control, worth 1 point, means there are existing controls in at least one of all applicable areas during the time of risk assessment. No control, worth 2 points, indicates there is no mitigation at all.
Adjustment factor
|
Rating |
Points |
Description |
|
Full Control |
|
Consistent control in all applicable areas |
|
Moderate Control |
|
Existing controls in one or two areas during the time of risk assessment |
|
No Control |
|
No control at all during the time of risk assessment |
Total Risk Rating
The total level of risk (risk rating) is determined by the product of the ratings for impact, intrinsic likelihood and the adjustment factor to reflect the contribution of existing controls or other mitigating factors to decrease the level of risk. The products of all the combinations of likelihood, impact and control levels are in given the table for the total risk rating below. The ultimate goal is to have full control in order to reduce the total risk rating to Low Risk wherever possible, while acknowledging that some external risks may only be addressed by contingency plans.
Total risk rating
|
|
|
Total Impact |
|
|
||
|
|
|
Low (8) |
Medium (9) |
High (10) |
|
|
|
Intrinsic likelihood |
|
8 |
9 |
10 |
Full (1) |
Control |
|
Low (1) |
16 |
18 |
20 |
Partial (2) |
||
|
|
24 |
27 |
30 |
No (3) |
||
|
|
16 |
18 |
20 |
Full (1) |
||
|
Medium (2) |
32 |
36 |
40 |
Partial (2) |
||
|
|
48 |
54 |
60 |
No (3) |
||
|
|
24 |
27 |
30 |
Full (1) |
||
|
High (3) |
48 |
54 |
60 |
Partial (2) |
||
|
|
72 |
81 |
90 |
No (3) |
||
Low Risk: 8 - 27 points (scores in blue cells)
Medium Risk: 28 – 54 points (scores in yellow cells)
High Risk: > 54 points (scores in red cells)
Medium and high risks are then further addressed through in risk evaluation.
Risk evaluation
Contributors to this section: PhilRice, Philippines (Gabriel Romero); CGIAR IAU (John Fitzsimon); Bioversity-ILRI, Addis Ababa (Alexandra Jorge); IRRI, Los Baños, Philippines (Ruaraidh Sackville Hamilton, Renato Reaño); ILRI, Addis Ababa (Jean Hanson); CIMMYT, Mexico (Thomas Payne); IITA, Nigeria (Dominique Dumet); ICRISAT, Patancheru, India (Hari D Upadhyaya); NCGR USDA-ARS, Oregon, USA (Barbara Reed); NCGRP USDA-ARS, Fort Collins, Colorado (Dave Ellis).
Once the current total risk rating is determined, the risk owners and higher levels of management consider whether the level of risk is acceptable. This will determine if additional control efforts or contingency planning should be made. Current technical or financial feasibility will be a factor in making decisions in this regard. However, such constraints should be explicitly considered and flagged so that they can be revisited either when new or cheaper technologies become available, or additional funding can be found to implement them.
Future course of action should be identified to deal with those risks where the current total risk rating is considered unacceptable, giving top priority to the highest assessed residual risks. The action plan comprises mitigation measures designed to reduce the risk level from High to Medium or Low total risk, by lowering the likelihood and/or cushioning the consequences through contingency planning such as provisions of safety backups of collections or information. Potential preventive controls are suggested in Table 1 and Table 2 that are by no means exhaustive, nor fully and directly applicable to all Centres. They can be amended, enhanced and tailored to each genebank to comprise a set of measures deemed adequate.
Possible contingency measures should also be considered for external risks for which the genebank cannot implement preventive controls and in the event that risks do occur, despite controls being put in place. Table 1 and Table 2 provide suggested controls and contingency measures that can be considered for particular risks.
To present an overall picture of the unacceptable risks and mitigation measures that are relevant to the subject genebank, these can be entered in a worksheet (table for risk management germplasm bank) for a quick monitoring guide.
Monitoring and review is concerned with analyzing and learning lessons from:
- Risk events or trends that occur.
- Changes in the external environment since this was last assessed.
- The results of ongoing surveillance and periodic auditing they control.
- Mitigating risks that continue to be appropriately designed and implemented as intended.
Responsibilities for monitoring and review should be clearly defined and documented.There should be a systematic consideration of the results to determine if changes to the risk management framework are required.
Decision support tool
Contact persons for Decision support tool: Daniela Horna, Jose Falck-Zepeda (IFPRI)
Contributors to this page: IFPRI, Washington (Daniela Horna, Melinda Smale); Bioversity International, Rome (Brigitte La Liberte); CIAT, Cali, Colombia (Arsenio Ciprian, Maritza Cuervo, Daniel Debouck, Roosevelt Escobar, Angela Marcela Hernandez, Graciela Mafla, Josefina Realpe Martinez, Luis Guillermo Santos, Orlando Toro); CIMMYT, Mexico (Victor Chavez, Bibiana Espinoza, Jonalyn Gumafelix, Thomas Payne, Marcial Rivas, Suketoshi Taba); ICRISAT, Patancheru, India (K.N. Reddy, V.G. Reddy, Dintyala Sastry, S. Singh, RP. Thakur, Hari D Upadhyaya); IITA, Nigeria (Ogundapo Ademola, Dominique Dumet, Victor Manyong); ILRI, Addis Ababa (Jean Hanson); Independent consultants (Victor Komerell, Bonwoo Koo); IRRI, Los Baños, Philippines (Socorro Almazan, Genevieve Mae Aquino, Patria Gonzales, Flora Guzman, Ruaraidh Sackville-Hamilton, Arvind Kumar, Charina Ocampo, Renato Reaño, Teresita Santos, Anthony Telosa, Miriam Telosa); AfricaRice, Cotonou, Benin (Ines Sanchez, Koichi Futakuchi).
Cost-effectiveness of collection management: Ex situ Conservation of Plant Genetic Resources in the CGIAR system
Through the participation in the GPG2 project the genebank from the CG system, SGRP and IFPRI have developed methods for assessing the costs and benefits of genebank operations. Since not all benefits associated with genebank operations can be estimated with certainty in quantitative terms, achieving cost-effectiveness (minimizing costs for a specific objective) is perhaps a more realistic goal than achieving efficiency (setting all marginal costs equal to all marginal returns). In consultation with genebank managers, a System-wide analysis has been undertaken to characterize the constraints, strategic choices and daily management decisions of genebank managers. A prototype methodology, including a computerized decision support tool has been developed and critiqued by System-wide genebank managers. Using the prototype tool, scenarios have been developed and hypotheses tested about the cost-effectiveness of integrating tasks and operations across the system.
Click on the image to download:
|
The decision support tool prototype (2 MB)
Download the prototype of the decision support tool by clicking on the image above. To be able to open this tool you will need Microsoft Office
|
The decision support tool survey
Participate in improving this decision support tool by sending your comments to Daniela Horna or by filling out the survey.
|
|
The user guide
Click on the image above to proceed |
The final report (6.5 MB)
Click on the image to access the GPG2 Final Report on evaluating the cost-effectiveness of collection management of plant genetic resources. |
References and further reading
Altoveros NC, Ramanatha Rao V. 1998. Analysis of information on seed germplasm regeneration practices. In: Engels JMM, Ramanatha Rao V, editors. Regeneration of Seed Crops and their Wild Relatives: Proceedings of a Consultation meeting, 4-7 December 1995, ICRISAT, Hyderabad, India. IPGRI, Rome, Italy. Available here.
Burstin J, Lefort M, Mitteau M, Sontot A, Guiard J. 1997. Towards the assessment of the costs of genebank management: conservation, regeneration and characterization. Plant Varieties and Seeds 10:163-172.
Calles T, Dulloo ME, Engels JMM, van den Houwe I. 2007. Best practices for germplasm management: A new approach for achieving genebank standards. Bioversity International. Available here.
Chakrabarty SK, Anitha K, Girish AG, Sarath Babu B, Rao PRDVJ, Varaprasad KS, Khetarpal RK, Thakur RP. 2005. Germplasm exchange and quaantine of ICRISAT mandate crops. Information Bulleting No. 69. Plant Quarentine Laboratory, ICRISAT, Patancheru, India.
Day-Rubenstein K, Heisey P, Shoemaker R, Sullivan J, Frisvold G. 2005. Crop genetic resources: An economic appraisal. A report from the economic research service. Economic Information Bulletin Number 2. United Stated Department of Agriculture.
De Boer L. 1992. Economies of scale and input substitution in public libraries. Journal of Urban Economics 32 (2):257-268.
ECPGR. 2008. A strategic framework for the implementation of a European genebank integrated system (AEGIS). Discussion Paper. European Cooperative Programme for Plant Genetic Resources (ECPGR). Bioversity International, Rome, Italy.
Engels JMM, Ramanatha Rao V. 1998. Regeneration of Seed Crops and their Wild Relatives: Proceedings of a Consultation meeting, 4-7 December 1995, ICRISAT, Hyderabad, India. IPGRI, Rome, Italy. Available here.
Epperson J, Pachico DH, Guevara C. 1997. A costs analysis of maintaining cassava plant genetic resources. Crop Science 37:1641-1649.
FAO. 2002. International Treaty on Plant Genetic Resources for Food and Agriculture: A global treaty for food security and sustainable agriculture. Food and Agriculture Organization of the United Nations, Rome, Italy.
Finch L, Christianson JB. 1981. Rural hospitals costs: an analysis with policy implications. Public Health Reports 96:423-433.
Fowler C, Hodgkin T. 2004. Plant genetic resources for food and agriculture: Assessing global availability. Annual Review of Environment and Resources. Vol. 29:143-179.
Hardaker JB, Huirne RBM, Anderson JR. 1997. Coping with risk in agriculture. Wallingford: CAB International.
Johnson N, Pachico D, Voysest O. 2003. The distribution of benefits from public international banks: the case of beans in Latin America. Agricultural Economics 29:277-286.
Koo B, Pardey PG, Wright BD. 2003. The economic costs of conserving genetic resources at the CGIAR centres. Agricultural Economics 29:287-297.
Koo Bonwoo, Pardey PG, Wright BD, Bramel P, Debouck D, van Dusen ME, Jackson MT, Rao NK, Skovmand B, Taba S, Valkoun J. 2004. Saving seeds: The economics of conserving crop genetic resources ex-situ in the future harvest centres of the CGIAR. Oxfordshire, UK: CABI Publishing.
Koo B, Wright BD. 2008. The optimal timing of evaluation genebank accessions and the effects of biotechnology. American Journal of Agricultural Economics 82 (4):797-811.
Li D, Prtichard H. 2009. The science and economics of ex situ plant conservation. Special issue: Plant science research in botanic gardens.
Liu LG. 2002. The cost functions and scale economies in academic research libraries. Library Trends 2002:406-420.
Mafla G, Roa JC, Aranzales E, Debouck DG. Handbook of procedures for in-vitro germplasm conservation of the genus Manihot. Genetic Resources - CIAT: Cali, Colombia.
Pardey PG, Koo B, van Dusen ME, Skovmand B, Taba S. 2001. Costing the Conservation of Genetic Resources: CIMMYT's Ex Situ Maize and Wheat Collection. Crop Science 41:1286-1299.
Rao NK, Hanson J, Dulloo ME, Ghosh K, Nowel D, Larinde M. 2006. Manual of seed handling in genebanks. Handbooks for Genebanks No. 8. Bioversity International, Rome, Italy. Available in English (1.5 MB), Spanish (1.4 MB) and French (1.9 MB).
Salcedo J, Debouck DG, Torres AM, Guevara C. 2006. Flow Chart of Operations for Bean and Tropical Forage Germplasm. Genetic Resources - CIAT: Cali, Colombia.
Smale M, Drucker AG. 2007. Agricultural Development and the Diversity of Crop and Livestock Genetic Resources: A Review of the Economics Literature. In: Kontoleon A, Pascual U, Swanson T, editors. Biodiversity Economics. Cambridge University Press.
Smale M, Koo B. 2003. Genetic Resources Policies: What is a Gene Bank Worth? IFPRI: Washington, D.C.: IFPRI, IPGRI, and the Systemwide Genetic Resources Program.
Taba S, van Ginkel D, Hoisington D, Poland D. 2004. Wellhausen-Anderson Plant Genetic Resources Center: Operations Manual. El Batan, Mexico: CMMYT.
Upadhayaya H, Gowda CLL, Sastry DVSSR. 2008. Plant genetic resources management: collection, characterization, conservation and utilization. SAT eJournal (ejournal.icrisat.org) An Open Source Journal published by ICRISAT: December 2006, Volume 6.
Virchow D. 2003. Current expenditures on crop genetic resources activities. In: Virchow D, editor. Efficient conservation of crop genetic diversity. Berlin: Springer-Verlag.
Virchow D. 1999. Spending on conservation of plant genetic resources for food and agriculture: How much and How efficient? ZEF Discussion Papers on Development Policy. Bonn: Center for Development Research.
Guide for users
Contributors to this page: IFPRI, Washington, USA (Daniela Horna); Independent consultants (Victor Komerell, Mauro Loayza).
|
Contents: |
|
Click on the image above to download the Decision Support Tool (2MB). |
As part of the Global Public Goods 2 Project, a prototype of a Decision Support Tool (DST) has been developed, based on the framework of Koo et al. (Saving Seeds, 2004). The tool can be used to:
- Document detailed input use per operation.
- Calculate the current costs of operating your genebank.
- Generate cost reports which can help you understand the cost structure of operating your genebank in the relevant year.
- Form the basis for making decisions about the efficient operation of your genebank in the long term.
The quality of such decision making will improve with the ability of multi-year comparisons, which will become possible as input information is entered in future years. Comparisons across genebanks will also make it possible to compare particular costs per similar type of accession or similar type of operation.
The tool serves to help each genebank identify its unit costs (e.g. cost of storing, regenerating etc. one accession) and, indirectly, to identify cost drivers (e.g. a factor which causes a change in the cost of an activity).
In future, the Tool can be improved to:
- Make it easier to input data.
- Include a purchasing power parity feature, so that more accurate comparisons of labour costs, for example, can be made.
- Generate other, different kinds of reports, driven by the decision making needs of one particular, or of all genebanks.
This is the second version of the DST. This version has been developed using Excel and Visual Basic. The main change in this version corresponds to its presentation and user friendliness. The basic structure for the estimation of genebank costs has not been affected.
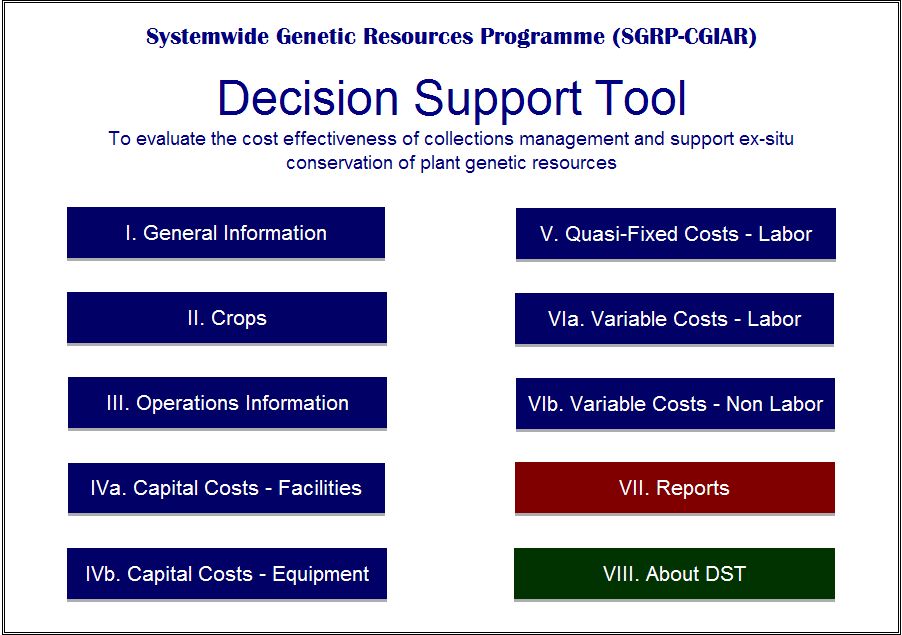
The tool has a front page that presents a menu of ten options that are links to the different sections of the tool (Figure 1). The first eight boxes (blue) are links to data entry about: general information, crops, activity tables, capital costs-facilities, capital costs- equipment, quasi-fixed cost, variable costs-labour, variable costs-non labour. The menu on the front page also has a red box that is a link to the report(s) and a green box that presents the credits of the tool.
The boxes can be accessed independently or you can follow the order proposed by the tool. Once you enter the relevant cost information into the five sheets, several cost reports regarding your genebank will be automatically calculated in the ensuing sheets.
Always remember that the quality of the final cost reports critically depends on your inputs!
Figure 1. DST starting page
General Information
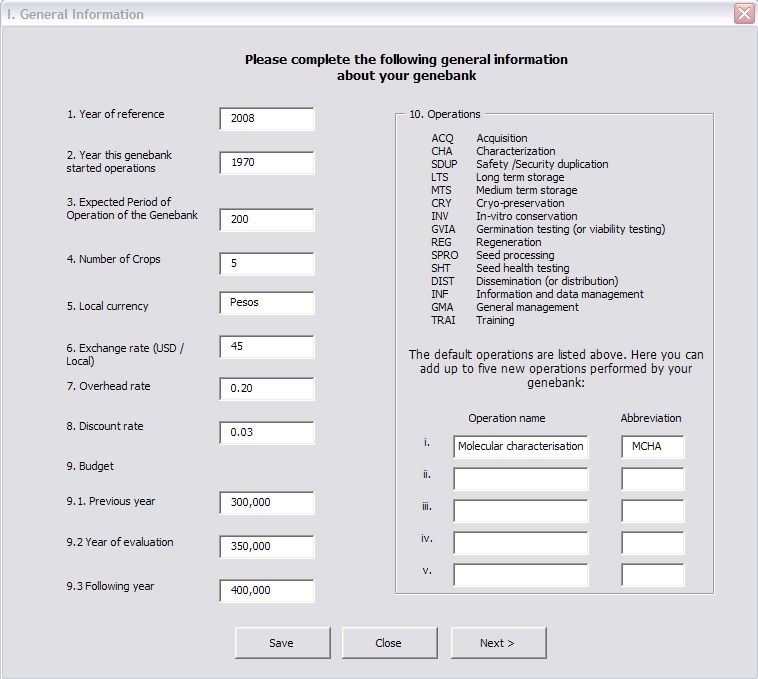
The general information box links to an entry form that serves to gather details about the genebank (e.g., genetic material, number of accession managed, etc.) and other factors that affect or can affect costs (e.g. discount factor used to estimate in-perpetuity costs, overhead rate). See Figure 2.
First, the user is requested to enter some general genebank information.
1. Year of reference - enter the year that is under evaluation.
2. Year that the genebank started operations.
3. Expected period of operation of the genebank.
4. Number of crops. The user is requested to enter the total number of types of genetic material that is held by the genebank. The tool will produce a report for each type of material.
Figure 2. General Information form
General Information
5. Local currency used in the country, where the genebank is located and exchange rate. While most of the expenses in the genebank are probably made in US dollars, some expenses are paid in the local currency. Fluctuations in the exchange rate can have a big effect on the final cost estimations.
6. Conversion or exchange rate during the year of evaluation (total local units equivalent to US$ 1).
Note: The cost information can be entered in local units or in US$. Points 3 to 6 are requested in order to appropriately perform conversions.
7. Overhead rate. Each Centre charges indirect costs or overhead rates (as a % of the total budget granted to a genebank/GRU). Some Centres charge an overhead AND a Research Support Services/DDG Research rate). This information is easily available in the finance department. The genebank costs are affected by the overhead rates charged by the host Centre. Overhead cost, also called operating expense, is the cost of maintaining property (e.g., paying property taxes and utilities and insurance); it does not include depreciation or the cost of financing or income taxes. This expense is not directly assigned to goods or services provided. Failing to include these overhead rates can lead to the underestimation of the total cost. The overhead rate is entered as a fraction of one, not as a percentage, therefore it normally varies from zero to one.
8. Discount factor. The value to be entered here is the average interest rate in the country where the genebank has their bank accounts. In the case of the CG system these accounts are usually kept in the US or sometimes in Europe. Therefore the value to use is the interest rate for the OECD countries. A discount rate is the interest rate used to find the present value of an amount to be paid or received in the future. This discount rate is used for annualizing the capital costs and also for estimating the in-perpetuity costs. The discount factor is entered as a fraction of one not as a percentage, therefore it varies from zero to one.
In the following three points the user is requested to enter some budget information. The objective of this request is to make comparisons between actual expenses and actual projected ones. These questions are not mandatory and will not affect the estimations of the genebanks costs.
9. Budget.
9.1. Previous year. Enter the budget prepared for the year previous to the year in evaluation.
9.2. Year of evaluation. Enter the budget information for the year of evaluation.
9.3. Following year. Enter the budget information for the year after the year of evaluation, if available.
How genebanks are organized and run depends on the type and range of accessions they hold and where they are located (e.g. the region, city or several locations etc.). It is difficult to incorporate all the differences into a single framework of operations (e.g. major activities, which all genebanks perform in one way or another). However, this tool categorizes various genebank operations in the following classification (Table 1.). In addition to the standard operations, a genebank can also perform other support operations. This is the purpose of point number 10 below.
10. Operations. You can add operations that are not included in Table 1. If the user would like to estimate the costs of these additional operations then the label has to be created here. Notice that you have to be ready to enter detailed information (number of accession manipulated, allocation of time and other resources per type of material, etc.) about this operation. Examples of other operations are biochemical & molecular characterization (in CIAT) and pre-breeding maize (in CIMMYT).
Table 1. List of standard operations, explanations and abbreviations used
|
Activity |
Explanation |
Code |
|
Acquisition |
This may involve the collection activities in the fields or the activities related to receiving and processing newly introduced accessions. |
ACQ |
|
Characterization |
This is the activity of recording the characteristics of each accession, often conducted during the regeneration process. |
CHA |
|
Safety duplication (or security duplication) |
This is the activity of sending sample accessions to different locations for safety reasons (i.e., backup collection). |
SDUP |
|
Long-term storage |
This activity is for the conservation of accessions in the long-term storage facility. Cold room and Cryopreservation mainly. |
LTS |
|
Medium-term storage |
This activity is for the conservation of accessions in the medium-term storage for ready dissemination upon request. Tissue culture, cold room, field genebank.
Notes:CIAT uses short-term storage (Corto Plazo). |
MTS |
|
Cryopreservation |
Cryopreservation / long-term storage. |
CRY |
|
In vitro conservation |
In vitro conservation / medium- and long-term storage, sub-culturing. |
INV |
|
Germination testing (or viability testing) |
This is the (periodic) activity of testing the germination rate of existing or newly multiplied accessions. |
GVIA |
|
Regeneration |
This is the activity of getting fresh seeds by planting out seeds for storage or dissemination. |
REG |
|
Seed processing |
This is the activity of packing, cleaning and drying seeds. |
SPRO |
|
Seed health testing |
This activity involves the testing of seed health, often carried out upon acquisition or during the regeneration process. |
SHT |
|
Distribution (or dissemination) |
This involves the activity of sending accessions upon request (e.g., preparation, shipment, etc). |
DIST |
|
Information and data management |
This activity includes data entering, processing and management (including catalogue preparation). |
INF |
|
General management |
This is the activity that is difficult to allocate to a specific activity (e.g., genebank manager's work). |
GMA |
|
Other |
Enter any other type of operation that is not included above. |
OTH |
Crops
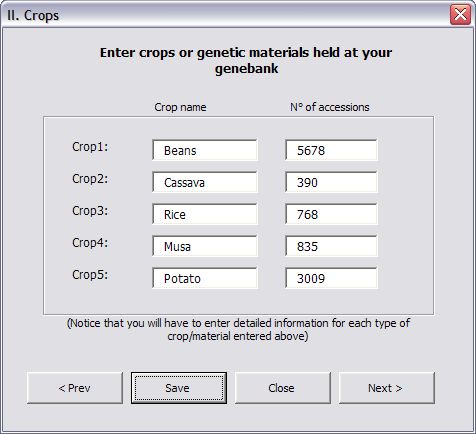
This box links to a form (Figure 3.) where the user has to enter the information about the type of material stored and total number of accessions stored in the genebank. Note that in the previous form (general information) the user has entered the number of materials; therefore the program has created the correct number of spaces to enter this information.
The information about number of accessions per type of material is estimate weights that can be used to distribute costs across types of materials stored in the genebank (on the basis of an estimated allocation rate). The user must decide in advance the classification of the type of material.
For example, IRRI can define the material stored as rice only or classify its holdings as rice and wild rice. Please note that all further information gathered by the Tool will be related to the type of material, as you have defined it.
Figure 3. Crops form
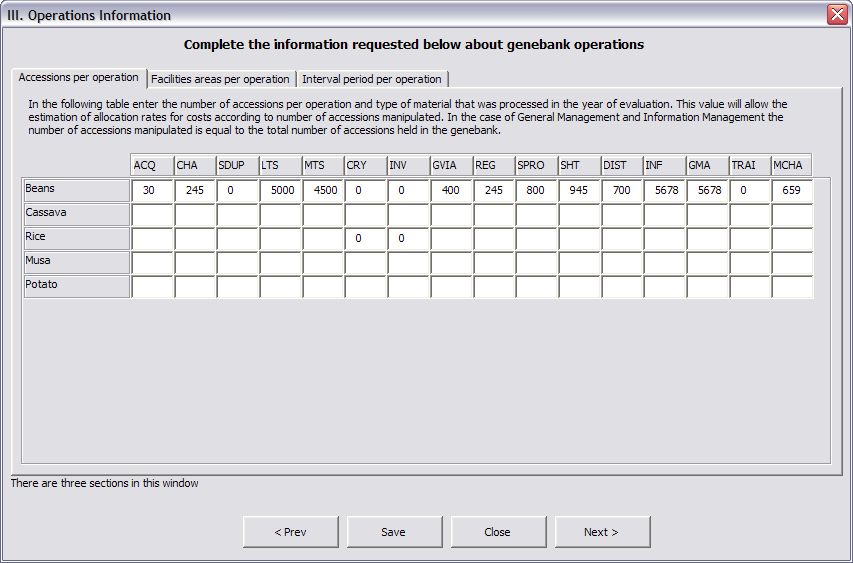
Operations Information
The form under this link requests three kinds of information about genebank operations:
1. Accessions processed (e.g. stored, regenerated, distributed to users, etc.) per type of material and per operation (Figure 4). This information will be used to develop a second allocation rate (across type of materials and per operation). It will also be used to proportionally distribute costs by the total number of accessions manipulated, when possible. In some cases such an allocation will not be possible. A clear example of this case is the manipulation of wild materials that often demand more resources and investment per accession than the cultivated materials.
Note that for general management and information management the value that has to be entered here is the total number of accessions. Also note that for the case of long-term and medium-term storage, the figure entered should be the total number of accessions stored for either case.
Figure 4. Operations Information: Accessions per operations form
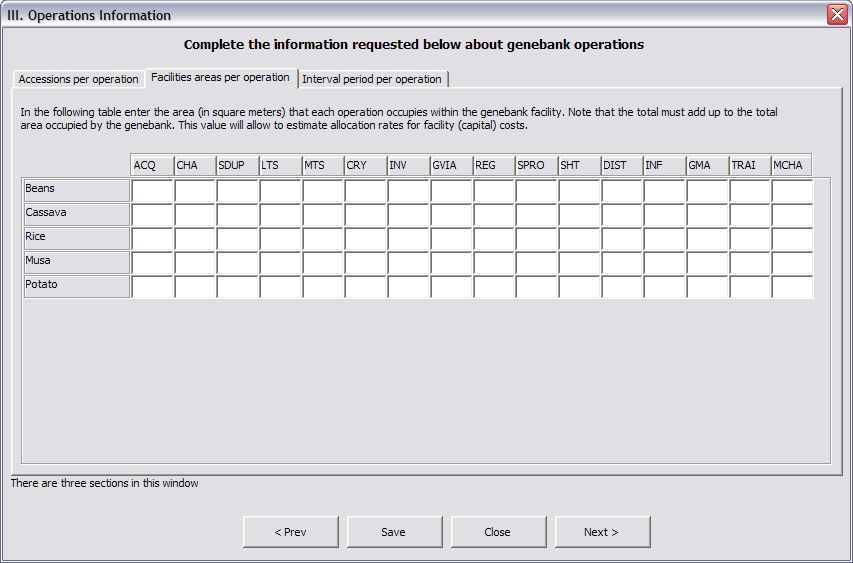
2. Facility area per operation. These figures are used to estimate the costs of the facilities (Figure 5). In future they will also be used to estimate service chargeback’s (or direct costs). Many genebanks in the CG system are ‘service-charged’ per square metre (m2) and this must be reflected in their budget requests. These charges usually correspond to services such as electricity, security, land use, computer equipment and services, information services (e.g. library), etc.
Figure 5. Operations Information: Facility area per operation form
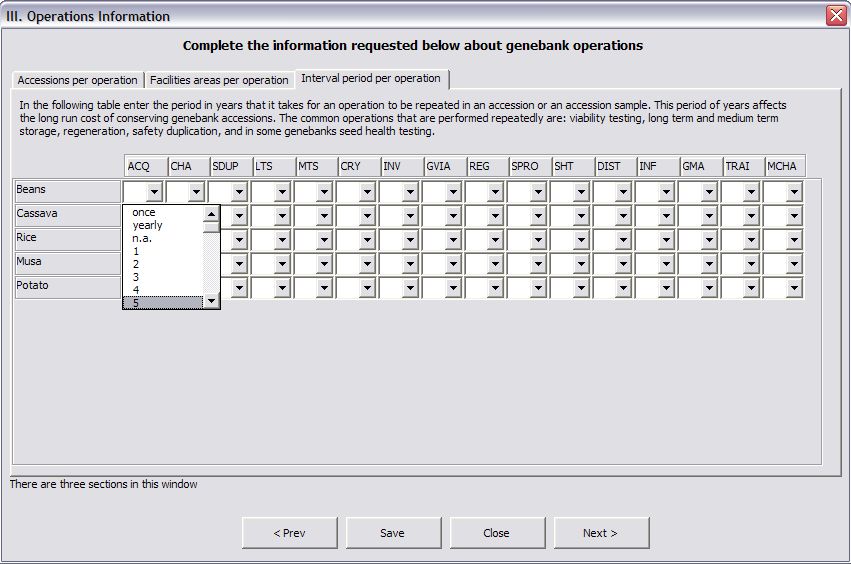
3. Period of Operations. Genebanks differ with respect to the frequency (e.g. time scales), with which they perform certain operations (Figure 6). For instance, although viability testing is a routine operation, depending on the genebank's internal protocol, it is performed every 5 -10 years for the same accession. An accession of beans sent to Fort Collins for safety duplication in 2008 will probably only be replaced in 50 years or so. ‘Period of operations’ information is used to produce the in-perpetuity costs. Please note the interval may vary with the operation, some operations only need to be performed once (e.g. seed health testing), others are performed yearly (e.g. general management, information, long-term and medium-term storage), yet others do not have a specific interval period as they depend on the availability of funds (e.g. acquisition). The user has to select the correct option on the drop-down menu in each cell.
Figure 6. Operations Information: Interval period per operation form
Capital Costs
In general, capital inputs are not sensitive to the size of the operation. The assumption is that a genebank needs buildings, lab equipment, etc. to operate at all, regardless of whether these capital inputs are used at full capacity or not. (Of course, sometimes genebanks need to expand, because their collections have grown or they perform new kinds of work, but that is related to Capital Investment, and thus to future costs of operations and not yet covered by the Tool). Capital inputs include infrastructure, such as germplasm storage and genebank facilities, and equipment for field operations and offices. In order to produce the annual costs of the genebank, current prices are converted to nominal prices using Consumer Price Index information already entered in the Tool and annualized using the discount rate requested in the General Information form.
Facilities
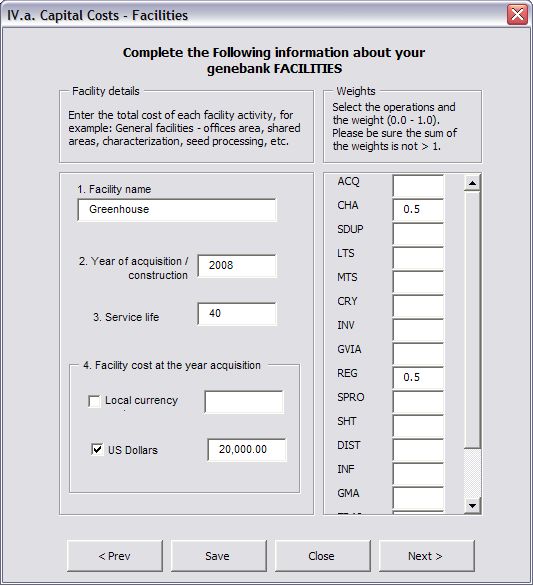
The user is requested to enter information about the genebank facilities (buildings, greenhouses, experimental plots, etc). The information requested is the basic information needed to estimate the annual costs to the genebank: Facility name, Year of construction or acquisition, Service life (in years), and Total costs of the facility (in local currency or US$). The user can enter the actual cost when the facility was built, or its current cost (area * cost of building(s)).
In addition, the user has to identify the main uses (operations) of the facility and allocate weights accordingly (Figure 7). The weights have to be expressed as fractions of 1 so they can vary from 0 to 1.
For instance if a greenhouse is used equally for regeneration and characterization the weight values used are 0.5 for characterization and 0.5 for regeneration.
Figure 7. Capital Costs - Facilities form
Equipment
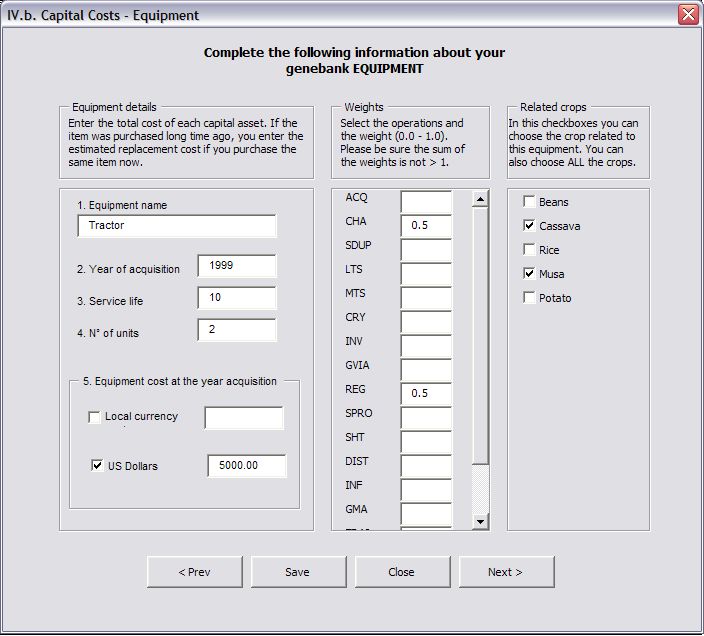
To correctly account for the expenses of genebank equipment the user has to enter the historic information (usually kept by the finance department in each Centre) of all the functional equipment. The detailed information requested includes: Equipment name, Year of acquisition, Service life (according to the CG depreciation policy), Number of units acquired, and Original price of acquisition. The price information can be entered in local units or in US dollars.
As in the case of the facilities, the user is requested to enter allocation rates of weights according to the operation that the equipment is used for. Not every piece of equipment is used for all types of genetic materials, therefore the user also needs to enter the crop or crops that the equipment is used for (Figure 8).
Figure 8. Capital Costs - Equipment form
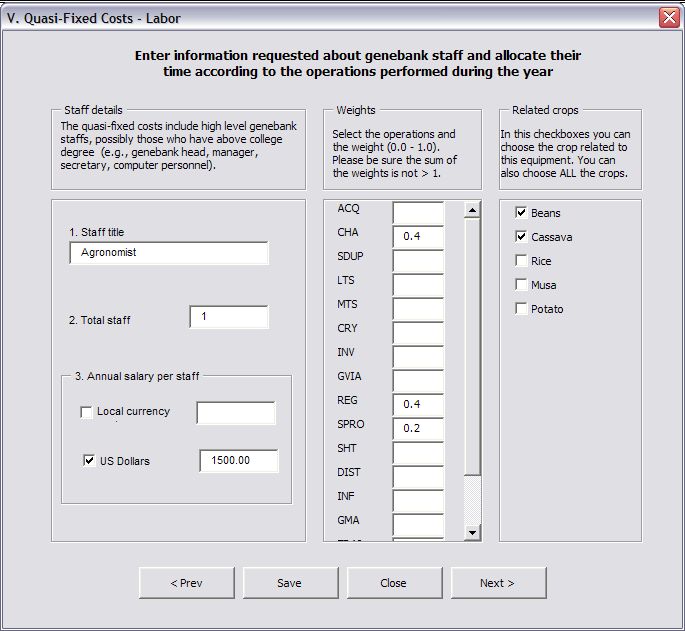
Quasi-fixed costs
Senior scientists and technicians are treated as quasi-fixed inputs. The assumption is that they are always needed, in particular to manage other staff, regardless of whether the genebanks overall workload grows or contracts. Quasi-fixed inputs are more variable than fixed capital inputs but unlike variable costs, they are not easily apportioned, when the size of the operation changes.
All the scientific staff and permanent staff working in the genebank are entered in this form. The first information requested is the staff title (e.g. technician, pathologist, agronomist, etc). The user has to enter the number of staff holding this title and the annual average salary paid to this category of staff.
Here, as in the case of capital costs, the user has to enter the weights or allocation rates according to operations that the staff are involved in. For instance if an agronomist is in charge of regeneration, characterization and seed processing of the materials, then the user has to enter the corresponding weight for this staff. The time allocation can be obtained directly from the staff or from the supervisors.
Some genebanks have scientific staff, who work on one specific crop. In other genebanks, the staffs' responsibilities are shared across type of materials. The user should be clear about this before completing this form. For instance the agronomist mentioned before could be in charge of crop 1 (c1) and crop 2 (c2). In that case then the user needs to click on c1 and c2.
Note that the salary information includes benefits, but it does not include indirect costs. The indirect costs and/or overhead rate are added later on.
Figure 9. Quasi-Fixed Costs - Labour form
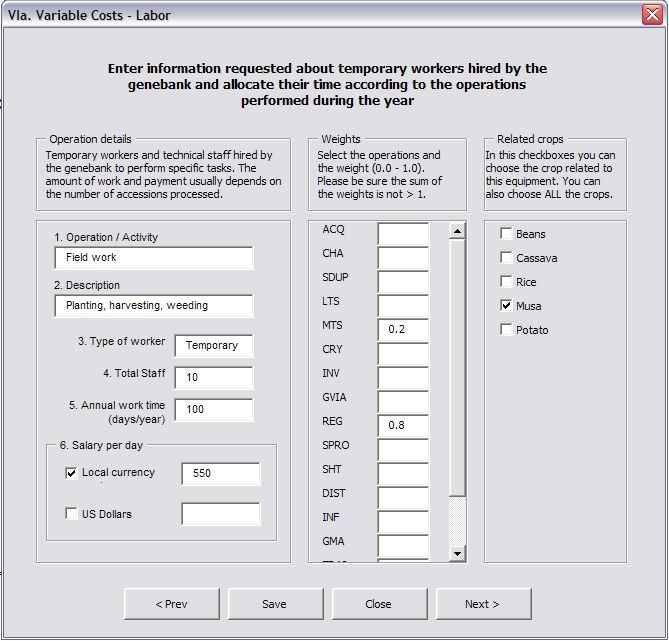
Variable labour costs
Variable inputs are sensitive to size of the operation. Variable inputs include non-labour costs and some labour costs. Variable labour costs refer to salaries paid to temporary workers and non-senior staff (and consultants, who perform temporary work within a given year). This form is completed in a similar manner to the one for Quasi-fixed costs.
All inputs used and expenses must be allocated by operation, using weights or allocation rates.
For example, the total cost of annually needed field labour for planting, harvesting and weeding is assigned to 0.8% to Regeneration and 0.2% to Medium-term storage. Allocating the inputs per type of operation requires expert knowledge about the demands of genebank operations. Genebank managers should be able to provide solid estimates, in consultation with their staff.
Figure 10. Variable Costs - Labour form
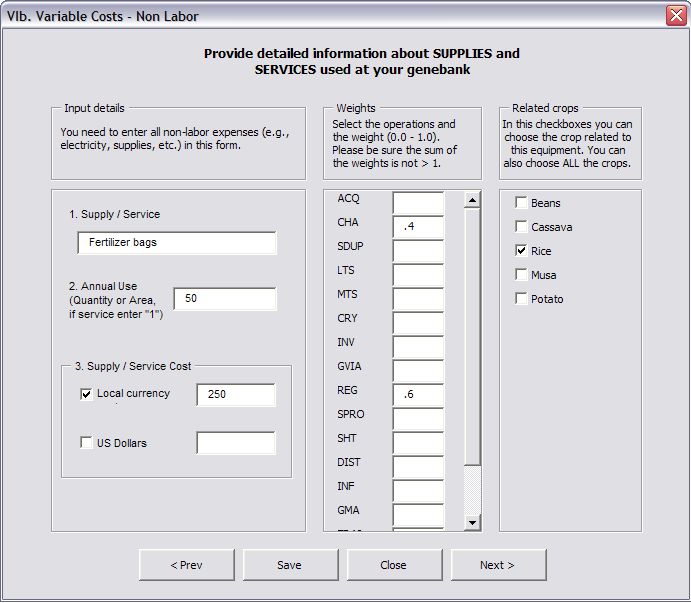
Variable Non-labour costs
Non-labour variable costs mainly include inputs consumed on a daily basis, like energy, office and laboratory supplies, per type of operation. For example, a genebank's total annual energy consumption needs to be divided up among all operations, which require energy. This category also includes the “direct, or service charges” that the Centers are in the process of implementing.
The user needs to enter detailed information about the name of supply or service, the annual use and the cost. The annual use is expressed in the same units as the price.
For instance if we are talking about fertilizer and the annual use is 50 bags (of 25kg) at a price of 250 pesos per bag, the user has to enter 50 in annual use, click on local currency and type 250 in the corresponding box. Fertilizer is used for field operations with weights of 0.6 for regeneration and 0.4 for characterization. Figure 11 illustrates this example.
Figure 11. Variable Costs - Non-labour form
Note: The best way to collect this information is:
1. With the person responsible for each operation, develop a list of all consumables/supplies needed to perform the different activities that are involved in this operation. Note that information about temporary labour is entered separately.
2. To the best of your abilities, please enter the annual requirement of each supply as 1 unit of supply per x number of accessions and total that for a year.
For example, viability testing requires the use of petri dishes and paper. So if in a given year 2000 accessions were tested and the ‘unit of supply use’, per 1 accession, is 1 petri dish and 1 paper unit, then the annual use would be 2000 petri dishes, and 2000 filter paper units.
3. There will be a number of supplies used on a daily basis whose use is impossible to quantify per accession. In this case, estimate the volume of a particular item of supply used per annum.
4. For other supplies that are not quantifiable per accession and which are not used on a daily basis, or are not directly used in a particular activity (i.e. soap, printer ink, gloves, etc.), the user should get information about annual (lab) expenses from the finance department.
The DST has the potential to produce different types of output reports according to users’ needs.
The main report presents costs per input category, genetic material and operation. The report provides information about both total costs and average costs per accession, as shown in the report of total and average costs. The report also includes a graphic representation of the distribution of total costs. In the current version of the tool, this graph depicts the distribution of costs per input type, but other graphs could be developed based on expressed needs of genebank managers. This report could be used to keep updated information about the fluctuation of annual average costs across the years due to a number of factors like: exchange rate fluctuations, changes in the number of accession manipulated due to budget changes, effect of the overhead costs on total costs, effect of direct charges on the total and averages costs. The genebank manager can also use this report while deciding how to allocate resources across operations.
Two other kind of reports that can be generated using the tool:
1. A per-accession costs report of conservation and distribution. This report provides a wider picture of resources needed on an annual basis in order to fulfill the genebank goals. It can be use for fund raising purposes; and
2. Total annual and in-perpetuity costs of conserving and distributing all existing accessions in the genebank. This report could be used for funding purposes, as it helps in identifying all resources needed for keeping the genebank operating in perpetuity. This report answers the question of how much money is actually needed now to keep the genebank running in perpetuity at the current level of operation (given the number of accessions stored in and distributed from the genebank).
The Tool has been developed to record yearly information. Notice that the estimations in the report are based on one-year performance. There might be a large variation in the results as they can be affected by the conditions in a particular year. For instance if the information is collected for a particularly dry or particularly wet year, it is quite possible that the costs of field operations (i.e. characterization and regeneration) would be higher than normal. Ideally genebank cost estimations should be based on a number of years.
Section 2 of this guide presents how to use the Tool and enter the information for the very first time. After this, the information in the Tool needs to be updated annually:
- Capital costs: the user needs to verify that all the capital equipment listed in the database is still functional, or if some facility or equipment has been added or discarded.
- Quasi-fixed costs: similarly the user has to double check the staff listed under this category and make the necessary entries.
- Variable Labour and Non-labour costs: verify with the genebank staff the total number of temporary staff hired in the year. These values tend to change every year.
Notice that currently the forms are only to enter new information and do not allow for identification and deletion of old/outdated information. The user would need to go to the spreadsheets and make the necessary modifications manually.
The current version of the DST is more friendly for data entry and the generation of basic reports. There is, however, room for improvement:
- Ideally the information of several years should be stored automatically without the need to open a new file each year.
- The reports generated should be more detailed as the information over several years is accumulated.
- The use of add-in software could support the processing of the information and the presentation of results. For instance the use of @Risk software has help in the development of simulations. See Final Report Activity 2.4 (6.5MB) for examples.
Feedback from users is therefore very important for updating this Tool. Also notice that the file is unprotected, so the user can modify this program according to their needs.
References and further reading
Horna D, Kommerell V, Loayza M. 2010. Guide to Users. Decision Support Tool. Collective Action for Rehabilitation of Global Public Goods CGIAR Genetic Resources Systems - Phase 2 (GPG2). Available here (5.5MB).
Koo Bonwoo, Pardey PG, Wright BD, Bramel P, Debouck D, van Dusen ME, Jackson MT, Rao NK, Skovmand B, Taba S, Valkoun J. 2004. Saving seeds: The economics of conserving crop genetic resources ex situ in the Future Harvest Centres of the CGIAR. Oxfordshire: CABI Publishing.
More Articles...
- Evaluating the Cost-Effectiveness of Collection Management: A Methodological Framework
- Overview: Testing tissue-culture material of clonal crops for pests
- Pest list identification and prioritization
- Testing
- Diagnostic protocols for sweet potato germplasm
- Viruses - sweetpotato
- Bacteria - sweetpotato
- Phytoplasma - sweetpotato
- Diagnostic protocols for potato germplasm
- Viruses - potato
Subcategories
-
main
- Article Count:
- 11
-
Stog
- Article Count:
- 2
-
Stog-rice
- Article Count:
- 7
-
Stog-sorghum
- Article Count:
- 11
-
Stog-common-bean
- Article Count:
- 10
-
stog-forage-legume
- Article Count:
- 10
-
stog-forage-grass
- Article Count:
- 11
-
stog-maize
- Article Count:
- 9
-
stog-chickpea
- Article Count:
- 10
-
stog-millets
- Article Count:
- 12
-
stog-barley
- Article Count:
- 10
-
stog-groundnut
- Article Count:
- 9
-
stog-pigeon-pea
- Article Count:
- 8
-
stog-wheat
- Article Count:
- 10
-
stog-lentil
- Article Count:
- 9
-
stog-cowpea
- Article Count:
- 10
-
stog-faba-bean
- Article Count:
- 9
-
risk management
- Article Count:
- 4
-
decision support tool
- Article Count:
- 3
-
stog-clonal
- Article Count:
- 23
-
developing strategies
- Article Count:
- 4