


CGKB News and events Management strategies
Evaluating the Cost-Effectiveness of Collection Management: A Methodological Framework


Contributors to this page: IFPRI, Washington (Daniela Horna, Melinda Smale); Independent consultant (Bonwoo Koo); Bioversity International, Rome (Ehsan Dulloo); CIMMYT, Mexico (Thomas Payne); IRRI, Los Baños, Philippines(Ruaraidh Sackville-Hamilton); ILRI, Addis Ababa, Ethiopia (Jean Hanson); WARDA, Cotonou, Benin (Ines Sánchez); CIAT, Cali, Colombia (Daniel Debouck); Bioversity International, Belgium (Ines van der Houwe); ICRISAT, Patancheru, India (Hari Upadhyaya); Bioversity International, Ethiopia (Alexandra Jorge).
|
Introduction |
Conserving germplasm is a long-term activity that requires a long-term perspective, but genebanks are typically funded on a short-term basis (Koo et al. 2004). Phase 1 of the project “Collective Action for the Rehabilitation of Global Public Goods in the CGIAR Genetic Resources System” (GPG), the thorough analyses of conservation costs previously undertaken by the Systemwide Genetic Resources Program (SGRP) (summarized in Koo et al. 2004), and other economics research about the benefits of genebanks have demonstrated the importance of sustained funding and the high expected benefits of ex-situ conservation relative to costs, assuming “good practices” (summarized in Smale and Drucker, 2007; Smale and Koo 2003; for the case of a large national genebank, see also Day-Rubenstein et al. 2006).
The expansion of genebank collections from the 1970s through the 1990s led to management challenges. These included the duplication of accessions, backlogs in regeneration, and insufficient or untimely provision of information to users (Altoveros and Rao 1998; Engels and Rao 1998; Koo and Wright 2008) . At the same time, there was increasing recognition that integration and coordination of the collections as a global system offered important functional and economic advantages. In 1995, SGRP commissioned an external review of the CGIAR genebanks to provide an assessment of what was needed to meet conservation standards. The first phase of the GPG project addressed the main recommendations from this review, including amelioration of genebank facilities and genebank procedures.
The second phase of the project (GPG2) builds on the progress made in the first phase, with a focus on establishing good standards and practices in genebank operations and encouraging a systems perspective. The current challenge, as viewed by those engaged in this project, is not to increase the numbers of accessions, but to ensure the quality, security, accessibility and sustainability of the in-trust collections. An underlying assumption is that a better allocation of resources will lead to better performance.
Presently, genebanks operate according to protocol manuals. These manuals are recognized as useful, but they do not ensure best practices. Clearly, establishing a set of best practices based on performance indicators will increase the probabilities of delivering a high quality product because the chances of making a technical mistake will decrease. What is less clear is how these performance indicators relate to genebank expenditures. As genebank managers point out, in any case, there is a need to examine the cost-effectiveness of operations (output per cost).
The goal of the economics task in the GPG2 project is to develop and disseminate a computerized tool that will support strategic decision-making by genebank managers. The objectives of this document are to a) provide a conceptual framework for the tool and b) demonstrate how the tool can be used to evaluate the effects of decisions on the allocation of resources across operations. Effects of decisions are illustrated by two types of outputs: a) cost summary reports and b) sensitivity analysis with simulations. Thus, it is expected that genebank managers will be able to apply the tool to answer management questions and craft strategies in pursuit of good practices or to enhance their performance. Eventually, the tool could be generalized in order to explore the effects of resource allocation decisions within an integrated genebank system.
This study is divided into six sections. The second section discusses some fundamental concepts on which the framework is based. Section 3 outlines a decision support tool that builds on the work previously undertaken by the SGRP. This section describes the type of information genebank managers need to apply to the tool and the outputs that can be produced. Notice that a single set of cost data (representing one point in time) allows us to minimize cost only with respect to the technology and set of practices represented by those data. To draw conclusions concerning optimal allocation of resources within a single bank over time, and among banks, additional points corresponding to other technologies and practices are needed. Section 4 and 5 presents two additional analyses that can be conducted with additional observations: sensitivity analysis and regression analysis. In the last section, we discuss some considerations for the implementation of this framework as well as next steps for this activity.
Genebank operations
There is no disagreement over the main purpose of a genebank, which is to conserve genetic material and make it available to users. However, a review of genebank protocols suggests that agreement has not yet been reached on a general classification of activities and related terminology (Rao et al. 2006; Taba et al. 2004).
Pardey et al. (2001) and Koo et al. (2003) group genebank activities into operations performed to reach genebank objectives. Orienting their description toward “best practices,” Calles et al. (2007) classify genebank activities and inputs according to the specific objectives. Many operations are comparable across Centers, but other activities are specific to reproduction system of the crop, such as propagation and multiplication strategies. Seed propagated crops like wheat or rice are the easiest to handle and can be conserved for longer periods than clonal crops like cassava or banana (Rao et al. 2006). Figure 1a depicts some of the main activities of a seed germplasm bank. Figure 1b presents a generic flow of operations.
Figure 1. Genebank flow of operations
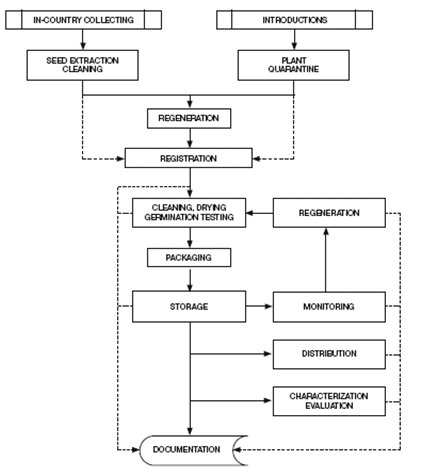 a. General sequence of operations in a seed genebank (source: Rao NK et al. 2006) |
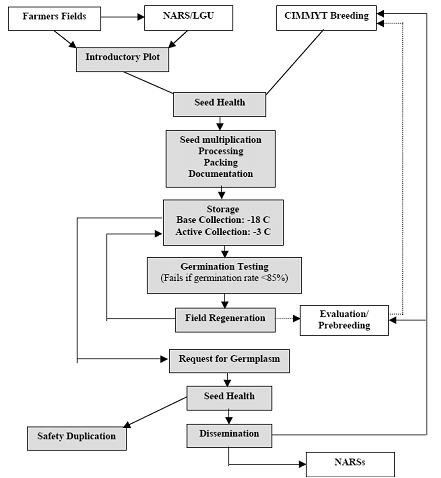 b. Generic flow of operations in a CG genebank (source: Pardey et al. 2001) |
In this study, an operation in understood as a cluster of activities and a number of operations are performed in order to reach a genebank objectives and thus genebank goals. Conservation and use of the genetic material are the two main goals of a germplasm bank. Specific objectives for achieving better conservation of genetic materials are:
- To cover the gene pool as much as possible
- To ensure the security (physical security and viability) of the genetic material
- To maintain its genetic integrity
Specific objectives for achieving a wider use of genetic materials are:
- To ensure the availability of the material to users
- To distribute the material
- To provide information
Best practices
The issue of quality standards is central to the management of any genebank. Genebanks in the CG system have operated with two sets of conservation standards: acceptable and preferred. Acceptable standards are considered to be minimal but adequate, while preferred standards guarantee better and safer conservation conditions. Evidently, meeting the preferred standards is more costly. Acceptable standards have been more frequently adopted as a consequence of budget constraints, leading to wide variation in quality standards across centers.
The CG genebanks are now directed toward “best practices,” which is a more dynamic, less easily defined concept of quality management. Genebank managers have not yet reached a consensus regarding the operational meaning of best practices. In some cases, “best practices” are viewed as activities that mitigate the risks that impede the achievement of objectives (conservation and use). In other cases, “best practices” are simple understood as the most effective practices given the technology that is currently available to the research center. In this study, we understand best practices as the costs incurred in order to reduce the chances of mistakes in technical procedures or in the delivery and distribution of genetic materials and related information to use. Different managers may have different degrees of tolerance of error probabilities, although they might agree on a standard threshold. Therefore the concept of best practices is directly linked to that of risk management. Ideally, implementing best practices based on performance levels as expressed by a set of indicators should minimize spending subject to an acceptable threshold of risk, a current conservation technology, and a current organization of collections. This would be one point of optimal resource allocation. Other optima would correspond to other conservation technologies, other risk thresholds, or a different organization of collections in the genebank system.
Performance indicators
Performance indicators measure the quality of an operation or a system in quantitative terms. Good performance indicators should be simple and measurable, while capturing the essential features of a complex system. Identifying performance indicators for the CG genebanks is another activity (No. 6.1.2) of the GPG project . Initial version of performance indicators identified for the GPG project are presented in Annex 1: Preliminary performance indicators for the GPG project. The task group has identified three kinds of performance indicators: technical operations indicators, impact and relevance indicators, and international collaboration indicators. For this study, only technical and impact indicators are considered to be relevant.
The framework proposed here would allow managers to discern how they might improve performance through re-allocating resources, or how they might maintain performance despite budget constraints. However, performance indicators must be defined in order to continue implementing the framework outlined in this document. The initial challenge is to make the right assumptions about the links among performance indicators, input use and costs. These links may not be as intuitive as expected. The variation in life cycle of the different operations conducted in the genebank, the share of resources allocated by genetic material, activity and/or operation diffuse the effect of input use on performance, making it difficult to isolate and establish causal relationships.
A review of CGIAR genebanks in the mid-1990s demonstrated the need for upgrading management of the in-trust collections. In response, SGRP organized a series of economic studies to determine the costs of the maintaining collections and proposed upgrade. The GPG project was established to facilitate the upgrade. During the first phase of the project, which started in 2003, in close consultation with several CG genebank managers, Koo et al (2004) compiled and analyzed genebank cost information.
The analytical framework for the cost studies was the micro-economic theory of production (Pardey et al. 2001). A genebank, like a firm, is organized to produce outputs (numbers of accessions characterized, stored, regenerated, etc.). Production decisions involve choosing which outputs to produce in which amounts, with which mix of inputs and input quantities. In the framework of economic decision-making, optimal resource allocation can be achieved either by minimizing the costs of operation given fixed physical resources and existing technology or by maximizing production subject to a fixed budget and existing technology. By duality theory, it has been proven that both approaches produce the same production possibility frontier. The production possibility frontier then traces the points corresponding to efficient resource allocations.
This approach selected by Koo et al. (2004) was cost minimization—for a very important, practical reason. Most of the benefits of genebank collections are public goods whose values are both expensive to estimate and likely to be unreliable estimated (see Smale and Koo 2003). By comparison, the costs of genebank operations are relatively easy to estimate with a fair degree of precision. Pardey et al. (2001) reasoned that if the costs of conserving an accession are shown to be lower than any sensible lower-bound estimate of the corresponding benefits, for many decisions, it may not be necessary to estimate benefits.
The data compiled by genebank managers on input use and expenditures was used to estimate average and marginal cost per unit. Average costs are the costs for the genebank of managing 1 accession. Marginal costs are the increase in total costs from the addition of one more accession to the genebank. Total costs include costs that vary and costs that are fixed in the relevant range of production. Average fixed or quasi-fixed (genebank management) costs normally decline as output increases. A standard assumption of micro-economic theory is that marginal costs initially decline as more is produced in a plant and eventually increase due to diminishing marginal returns to fixed factors (e.g., land, plant). Marginal cost is equal to average total costs when average total cost is at a minimum. Notice however that often genebanks operate below capacity, average costs then represent only upper bounds estimates of the marginal costs. Figure 2 illustrates how average and marginal costs are thought to change with amounts produced (for example, the number of seeds stored, regenerated, disseminated, etc).
The research summarized in Koo et al. (2004) represents only a single year of data for 5 CG Centers. In order to evaluate genebank costs more generally a broader cross-section and longer time series is vital. Unfortunately, genebank operation costs have not been systematically recorded in the CG system. This information must be gathered in a uniform and systematic way in order to facilitate comparison across genetic materials and across centers. The use of the decision support tool, described below, could facilitate the implementation of a system for periodic data collection by managers. Managers can use this information to monitor and evaluate their own performance, and as in input into strategic organizational decisions.
Figure 2. Genebank average and marginal cost
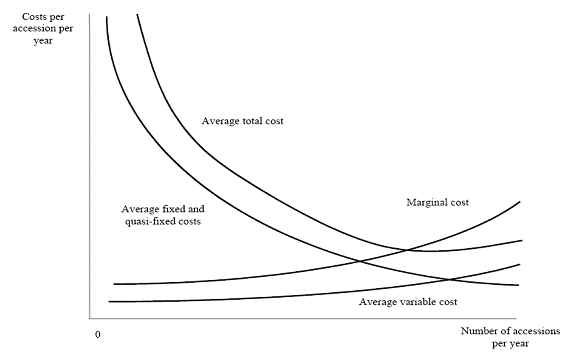 (source: Pardey et al. 2001.) |
A prototype of a decision support tool has been developed based on the framework of Koo et al. (2004). The first purpose of the tool is to store detailed input use per operation and generate cost reports. So far, the tool has been developed as an excel file with an introduction sheet, a general information sheet, 3 input sheets (non-labor, labor and capital inputs) and 4 output sheets or reports (see Annex 2: Decision Support Tool). The introductory sheet provides a brief explanation of the purpose of the tool and the framework used to classify activities, inputs and costs. The general information sheet elicits details about the genebank (e.g., genetic material, number of accession managed, etc.) and other factors that affect costs (e.g., discount factor, overhead rate, period for performing operations).
Detailed input use and related expenses are entered in the decision tool, dividing the information by type of input (the categories are capital, labor and non-labor). In general, capital inputs are not sensitive to the size of the operation. Capital inputs include infrastructure, such as germplasm storage and genebank facilities, and equipment for field operations and offices. Variable inputs, on the other hand, are sensitive to size of the operation. Variable inputs include non-labor costs and some labor costs. Non-labor variable costs mainly include inputs consumed on a daily basis, like energy, office and laboratory supplies. Variable labor costs are salaries paid to temporary workers and non-senior staff. Senior scientists and technicians are treated as quasi-fixed inputs. Quasi-fixed inputs are more variable than fixed capital inputs but unlike variable costs, they are not easily apportioned when the size of the operation changes.
All inputs used and expenses must be allocated by operation using rates. For instance, the total energy consumption in a genebank must be distributed among all operations that required energy. Allocation requires expert knowledge about the demands of genebank operations. Genebank managers thus are the persons who, in consultation with their staff, are most able to provide good estimates of allocation rates. Information about inputs is used to determine capital costs, quasi-fixed cost, variable costs, and genebank total costs. Allocation rates disaggregate these costs per operation.
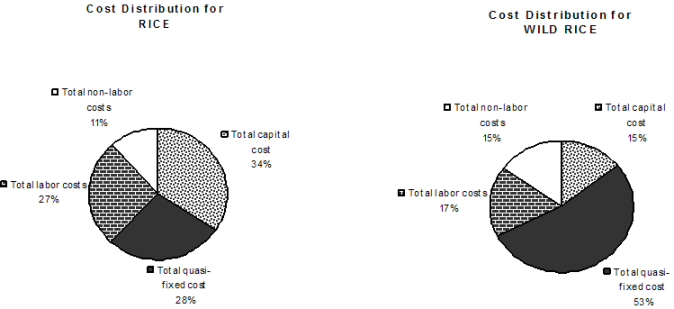
To produce output reports, total costs are broken down into capital, variable, and quasi-fixed costs. To illustrate, we used the example of the WARDA genebank in 2006, provided to us by the genebank manager. In addition to a summary overview by crop and input costs (see Annex 3: DST - Summary Report), three kinds of output reports can be generated. The first output reports costs per input category, genetic material, and operation, as shown in Table 1: DST Report1. The report provides information about both total costs and average costs per accession. The report also includes a graphic representation of the distribution of total costs (Figure 3). In the current version of the tool, this graph depicts the distribution of costs per input type, but other graphs could be developed based on expressed needs of genebank managers.
The second output corresponds to annual and in-perpetuity average cost per accession classified in terms of either conservation or distribution costs (Table 2: DST Report 2). Acquisition, viability testing, duplication, storage, and regeneration are operations that need to be performed in order to conserve an accession. Characterization, storage, regeneration, and dissemination are operations that are necessary in order to be able to distribute an accession. Costs are estimated for both new accessions and existing accessions, to indicate the additional cost of acquiring new accessions as compared to managing current accessions. The last output summarizes distribution and conservation costs associated with maintaining all existing genebank accessions (Table 3: DST Report 3). In this analysis, distribution costs are treated as short-run costs and conservation costs are considered to be “long-run” costs. This report shows the annual and in-perpetuity costs for the genebank. Such information is useful when justifying genebank funding or investment in ex-situ conservation.
While these reports help to understand the structure of genebank costs and their distribution across operations, objectives and over time, nothing can be inferred about the factors that affect these costs. For this reason, although it is possible to compare reports across genebanks, we do not have a picture that enables us to tackle strategic decisions. Two feasible ways to extend the use of the tool are discussed in the following sections.
Figure 3. Distribution of total risks
 |
Sensitivity analysis with simulations
When it is augmented by sensitivity analysis and simulations, the decision tool can be used to investigate how genebank costs and genebank performance are affected by changes in key parameters. An impediment to analyzing genebank costs across centers is the limited information that is available. One way to overcome this impediment is to elicit a range of possible values for key factors from genebank managers. For instance, a statistical distribution of annual costs per accession, or in-perpetuity cost of conserving all accessions, could be generated based on elicited values.
The @Risk™ software can be used to define or adjust distributions to available data and to perform the sensitivity analysis. The software allows for the substitution of single point values with a probability distribution. A triangular distribution is the simplest distribution to elicit that approximates a normal distribution. This distribution is widely used in decision theory, especially when no sample data are available (Hardaker et al. 1997). The parameters defining the distribution are lowest, highest and most common value. Means, variances and coefficients of variation are easily tabulated from these three values, and repeated sampling from the distributions can be used to generate overall distributions.
For instance, let us take the number-of-accessions-regenerated-per-year (NREG) as an example of a factor affecting costs in the WARDA genebank. We can ask the genebank manager for his or her “best guess” of the highest, lowest and most common values for NREG conditional on a reference period and technology. Using these three parameters, the software then generates a distribution of values for NREG. We could also generate unconditional distributions across technologies. Instead of a single value for total costs of maintaining a rice accession in the WARDA genebank, we would then have a distribution of values. The software can evaluate the simultaneous effect of more than one factor (input variable) on one or more than one cost variable (output variable). Simulations results using WARDA genebank data are shown in Figures 4a and 4b.
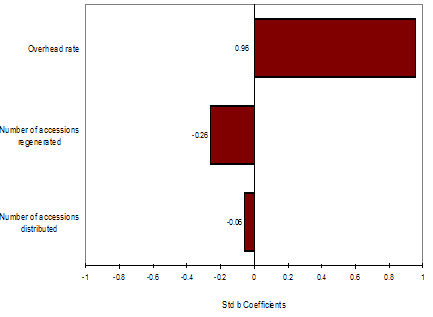
Fig. 4a Distribution for average quasi-fixed cost, Rice, WARDA. Fig. 4b Regression sensitivity average quasi-fixed cost, Rice, WARDA
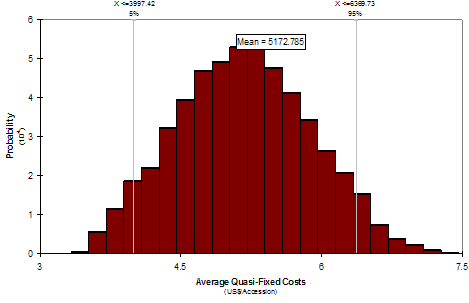
Instead of reporting just one value, figure 4a shows a distribution of values for average quasi-fixed cost of keeping one accession of rice in the WARDA genebank. This distribution of values respond to changes in: 1) number of accessions regenerated, 2) number of accessions distributed, 3) overhead rates, and 4) interval period for regeneration. Each of these variables has been replaced by a distribution of values. With this tool we can measure the effect of one or of multiple variables at the same time.
Figure 4b depicts the effect of individual distributions over the distribution of average quasi-fixed costs. From the factors evaluated (number of accessions regenerated, number of accessions distributed, overhead rate, and interval period to regeneration) overhead rate has the strongest effect on the increase of average quasi-fixed cost of rice accessions in the WARDA genebank. Average quasi-fixed costs decrease with an increase of number of accessions regenerated or distributed.
In the decision tool, factors affecting genebank costs are currently included in the “general information” sheet. Although preliminary simulations can be run based on this information, the aim of this task is to evaluate the relationship between performance and costs. As explained above, costs information is entered by activity. Certain activities must be performed in order to accomplish an operation. It is possible to find one or more performance indicators that are linked to an operation or an activity. The difficult in this case is that some inputs are used and activities performed for more than one operation. For example, regeneration is needed for conservation but also to ensure that genetic materials will be available for users (see Table 4: Relating genebank performance to costs).
Indices of genetic erosion might be used as performance indicators for the regeneration activity. Genebanks make use of variable, fixed and quasi-fixed inputs to regenerate the material and most importantly in order to maintain a low index of genetic erosion. If the genebank is not performing well and genetic erosion is high (or higher than the standard level/best practice recommendation), how should the manager allocate inputs in order to reduce the index of genetic erosion? Increasing a technician’s time in order to regenerate wild rice will most likely reduce the index of genetic erosion, but by how much? Thus, both the effect of input use on performance and the effect of performance on costs are difficult to grasp.
What would be the costs of reaching a “best practice” in the CG genebank system? How do location-specific variables affect genebanks costs? Genebank management decisions and their costs implications need to be evaluated to improve the performance of individual genebanks but also of the system as a whole. The second, longer-term objective the decision support tool is to provide answers to questions about the global genebank system. When enough observations have been assembled through application of the decision support tool, a genebank cost function can be estimated and specific hypotheses tested.
Genebanks costs depend on several factors: biological characteristics of the crop conserved, conservation methodology used (in vitro, field germplasm banks), institutional differences (wage structure, cost-sharing opportunities), local climate (for regeneration for instance, general state of infrastructure). The use of econometric methods will permit SGRP to evaluate the system as a whole by disaggregating the effect of the different factors and performance grade on costs. Once these effects have been taken into account in a multivariate regression, it will be feasible to draw conclusions across centers and genetic materials.
Cost function approaches have been used to model other public goods like hospitals and libraries, and this literature can provide insights into how we might specify genebanks costs. Finch and Christianson (1981) modeled the costs function of rural hospitals in US. The purpose of their study was to supply information about hospital costs that be used in making decisions regarding how the provision of health care to rural populations. The authors used quadratic and logistic specifications. The main advantage of the quadratic U-shape function is that a cost minimum can be determined given a fixed level of output. The logistic L-shape cost function implies that costs are decreasing but not in a constant rate to output, similar to what we assumed for genebanks. An additional contribution of this study is the use of output indicators to account for short run and long run costs. Conservation and distribution of genetic materials and information fit this characterization well.
Liu (2002) modeled a cost function for academic research libraries, taking into account the multi-product and multi-service nature of information provision by such organizations, which is comparable to genebanks. The author used a log-linear function and considered that some economies of scale exist in the operation of research libraries. Translog cost models have been also used for evaluating the costs function of research libraries. The use of a translog cost function is convenient when the goal is to determine elasticities of substitution among different inputs. De Boer (1992) used a translog cost function to examine economies of scale and input substitution elasticities of 194 Indiana public libraries.
If the objective of modeling genebank costs is to evaluate the relationship between cost and outputs with current technology and practices, logistic or quadratic specifications suit the purpose. If the objective is however to determine a technical relationship among inputs and outputs, a translog model would do better. It is always possible to test different specifications and evaluate which one adjusts better to our needs.
In specifying the model it is also important to define which cost to model: total costs or average (variable) cost. Modeling total costs would provide some additional information on capital and quasi-fixed costs. Since it is expected that changes in technology (mainly capital inputs) would improve performance of specific activities and operations, it may be better to model total costs than average variable costs. It is also possible to model total cost per operation.
Exogenous variables will include performance indicators for each output, a vector of crop characteristics, a vector of genebank characteristics, and a vector of staff characteristics. Genebank objectives can be classified according to either short or long term goals. This classification would help to determine short- and long-term minimum costs. Outputs related to conservation (covering genepool, maintaining genetic integrity and ensuring security) can be considered of a long-term nature while outputs of germplasm use (ensuring availability, providing information and germplasm distribution) are considered to be short-term outputs.
The general function could then be specified as:
|
TC=f(PI,Cr,Gb,St,L) |
PI = performance indicators (for either short of long term goals),
Cr = crop characteristics (multiplication strategy, fertilization, etc),
Gb = genebank characteristics (facilities, equipment),
St = staff characteristics (number, skills); and
L = location (dummies).
The selection of appropriate performance indicators is crucial. Conservation indicators might include the number of accessions stored, or indicators of diversity represented by the accessions. Indicators for use of germplasm might be the number of accessions added per year, the number of accession distributed, or the number of users of the genebank. Notice that the number of accessions added reflects the performance of genebank (technical operations) directly, while the other two indicators are related more directly to users and might be more appropriate if the goal is to measure the impact of a genebank.
The vector of crop characteristics includes the type of fertilization (open pollination, cross pollination) and type of seed reproduction system (sexual, clonal, tissue culture, etc). Differences in crops and reproduction system have a definitive effect on the costs. Genebank characteristics that can influence the cost function are related to the type of equipment and facilities. This information is also valuable to determine if the genebank is operating under excess capacity or not, and thus where economies of scale might be achieved. Staff characteristics variables can help to explain the effect on costs of staff qualification and the number of staff working in the genebank. The use of dummy variables is recommended to factor out location specific effects.
-
The decision support tool is in an early stage of development. The framework used to develop the tool (activities, operations, objectives, etc) is based on research produced during the first phase of the GPG project. The goal of this work is to produce a flexible tool that can be adjusted to represent a range of operations and genetic materials.
-
A consensus regarding a set of simple, quantifiable performance indicators is central to further progress in developing the tool. To be useful, the tool must be modified in order to incorporate data that measure performance.
-
The tool can be used to produce annual costs reports and a sensitivity analysis based on simulations. These evaluations can be accomplished per genetic material in a specific genebank. The longer term goal, however, is to evaluate genebank performance for the global genebank system. The tool can be used to assemble relevant data, and based on a review of cost studies of provision of public goods, we recommend econometric analysis as a means of evaluating the system.
-
The next steps involved in implementing the decision support tool are: a) assemble input use, costs information and feedback from genebank managers, b) add an input sheet for entering performance indicators, c) examine, with genebank managers, how costs can be structurally linked to performance indicators.
References and further reading
Altoveros NC, Ramanatha Rao V. 1998. Analysis of information on seed germplasm regeneration practices. In: Engels JMM, Ramanatha Rao V, editors. Regeneration of Seed Crops and their Wild Relatives: Proceedings of a Consultation Meeting, 4-7 December 1995, ICRISAT, Hyderabad, India. IPGRI, Rome, Italy. Available here.
Burstin J, Lefort M, Mitteau M, Sontot A, Guiard J. 1997. Towards the assessment of the costs of genebank management: conservation, regeneration, and characterization. Plant Varieties and Seeds 10: 163-172.
Calles T, Dulloo ME, Engels JMM, van den Houwe I. 2007. Best practices for germplasm management: A new approach for achieving genebank standards. Bioversity International. Available here.
Day-Rubenstein K, Heisey P, Shoemaker R, Sullivan J, Frisvold G. 2005. Crop genetic resources: An economic appraisal. A report from the economic research service. Economic Information Bulletin Number 2. United Stated Department of Agriculture.
De Boer L. 1992. Economies of scale and input substitution in public libraries. Journal of Urban Economics 32 (2): 257-268.
Engels JMM, Ramanatha Rao V. 1998. Regeneration of Seed Crops and their Wild Relatives: Proceedings of a Consultation Meeting, 4-7 December 1995, ICRISAT, Hyderabad, India. IPGRI, Rome, Italy. Available here.
Finch L, Christianson JB. 1981. Rural hospitals costs: an analysis with policy implications. Public Health Reports 96: 423-433.
Fowler C, Hodgkin T. 2004. Plant genetic resources for food and agriculture: Assessing global availability. Annual Review of Environment and Resources. Vol. 29: 143-179 .
Hardaker JB, Huirne RBM, Anderson JR. 1997. Coping with risk in agriculture. Wallingford: CAB International.
Horna D, Smale M et al. 2010. Evaluating the Cost-Effectiveness of Collection Mangement: A Methodological Framework. Collective Action for Rehabilitation of Global Public Goods CGIAR Genetic Resources Systems - Phase 2 (GPG2). Available here (5.8MB).
Koo B, Pardey PG, Wright BD. 2003. The economic costs of conserving genetic resources at the CGIAR centres. Agricultural Economics 29: 287-297.
Koo Bonwoo, Pardey PG, Wright BD, Bramel P, Debouck D, van Dusen ME, Jackson MT, Rao NK, Skovmand B, Taba S, Valkoun J. 2004. Saving seeds: The economics of conserving crop genetic resources ex-situ in the future harvest centres of the CGIAR. Oxfordshire: CABI Publishing.
Koo B, Wright BD. 2008. The optimal timing of evaluation genebank accessions and the effects of biotechnology. American Journal of Agricultural Economics 82 (4): 797-811.
Liu LG. 2002. The cost functions and scale economies in academic research libraries. Library Trends 2002: 406-420.
Pardey PG, Koo B, van Dusen ME, Skovmand B, Taba S. 2001. Costing the Conservation of Genetic Resources: CIMMYT's Ex Situ Maize and Wheat Collection. Crop Science 41: 1286-1299.
Rao NK, Hanson J, Dulloo ME, Ghosh K, Nowel D, Larinde M. 2006. Manual of seed handling in genebanks. Handbooks for Genebanks No. 8. Bioversity International, Rome, Italy. Available in English (1.5 MB), Spanish (1.4 MB) and French (1.9 MB).
Smale M, Drucker AG. 2007. Agricultural Development and the Diversity of Crop and Livestock Genetic Resources: A Review of the Economics Literature. In: Kontoleon A, Pascual U, Swanson T, editors. Biodiversity Economics. Cambridge University Press.
Smale M, Koo B. 2003. Genetic Resources Policies: What is a Gene Bank Worth? IFPRI: Washington, D.C.: IFPRI, IPGRI, and the Systemwide Genetic Resources Program.
Taba S, van Ginkel D, Hoisington D, Poland D. 2004. Wellhausen-Anderson Plant Genetic Resources Center: Operations Manual. El Batan, Mexico: CMMYT.
Upadhayaya H, Gowda CLL, Sastry DVSSR. 2008. Plant genetic resources management: collection, characterization, conservation and utilization. SAT eJournal (ejournal.icrisat.org) An Open Source Journal published by ICRISAT: December 2006, Volume 6.
Virchow D. 2003. Current expenditures on crop genetic resources activities. In: Virchow D, editor. Efficient conservation of crop genetic diversity. Berlin: Springer-Verlag.
Virchow D. 1999. Spending on conservation of plant genetic resources for food and agriculture: How much and How efficient? ZEF Discussion Papers on Development Policy. Bonn: Center for Development Research.
Overview: Testing tissue-culture material of clonal crops for pests
Contributors to this section: CIP, Nairobi, Kenya (Ian Barker); CIP, Lima, Peru (Carols Chuquillanqui, Segundo Fuentes, Ivan Manrique, Giovanna Muller, Wilmer Pérez, Reinhard Simon, David Tay); FERA, UK (Derek Tomlinson, Julian Smith, David Galsworthy, James Woodhall).
In the face of climate change and the urgent need to realise varieties with improved resilience to weather extremes the importance of germplasm collections for breeding is ever apparent. These collections must be made available with assurances of authenticity and freeness from pests1.
1Pest is used as by the definition of FAO to include both pests and disease, and extends to LMO
|
Contents: |
Some of the steepest challenges presented by climate change map onto developing countries where already marginal areas of land for production are potentially taken beyond the tipping point of production. Where these countries also map to some of the populations with the highest growth rates, any aspiration to meet the Millennium Development Goals for poverty reduction will require critical change.
A key element in meeting the challenge of climate change will be the cultivation of crops with superior adaptive traits and the cultivation of crops in new areas. The task before the plant breeder is therefore evident. Critical to this aim will be the sharing and movement of well characterised crop germplasms. It is the primary and historic mandate of the CGIAR to be the custodian of many of the most important collections of germplasms, notably of the staple crops of the poor, and to make these available as a global public good.
However, whilst the principle of sharing germplasm as a global public good is recognised, it is incumbent on the CGIAR to ensure that the germplasm are of a specified quality. Trueness to type (authenticity) and viability are the foremost and most evident criteria, but it is also required that germplasms are free of pests prior to movement. Within the literature are numerous records of pests spreading through breeding, and probably via tissue-culture material, with devastating consequences. And thus there is a cruel irony when the good intentions of breeders in sharing material for altruistic ends results in new pest introductions and steeper challenges to climb.
The IBPGR_GPG2 is specifically aligned to ensure seed originating from germplasms is available with assurances of pest-free status, by identifying the best practices that should be entailed to makes such claims. This section specifically looks at tissue-culture material of some of the main clonal crops.
This section aims to provide a ‘How to guide’ for parties requiring to test tissue-culture plants of clonally propagated crops for pests. In a series of stepwise processes the user is guided through stages of:
- Pest list identification for tissue culture plants
- Prioritisation of pest list in the context of the users needs
- Quality assurance within pest diagnostic laboratory procedures
- Identification of analytical techniques available for diagnosis and detection
- Review of analytical techniques in the context of the users requirement and resources available
- CIP case studies on potato and sweet potato
Information is further supplied on how the testing approach selected can be validated against a quality assured framework.
The premise for the process is based upon the principle of Systematic Review, whereby the end-point (the approach you take) is clearly defined, traceable and repeatable.
Whilst it is not the intention to provide any prioritisation of pests or recommendations on analytical methods, example is made where existing information is available. The example of the International Potato Centre and its approach to accreditation of a plant health passport for its international germplasm collections in Peru for potato and sweet potato is extensively presented.
In this context the section aims to be a living and dynamic resource and provides provision for further population. It helps to identify current gaps in knowledge and best practices and encourages the international community to address these areas.
Scope: clonal crops covered and pest focus
The section identifies with the 5 main clonal starch crops. Namely, banana, cassava, irish potato, sweet potato and yam. We recognise that many other crops can be propagated by tissue-culture and, if untested, present a pathway for pest spread. Mindful of this, the section is rich in ‘the principle of approach’ and not dogmatic as to what should be applied.
Primarily the resource identifies the need to test for virus and phytoplasms, although some bacterial and fungal pests may equally be of concern. The approach described also allows address for the detection of genetically modified material within tissue culture material.
The user and framing the question
As a user of the section, you will have in mind a question. In developing the section, we have tried to position ourselves as a user so as to better identify the question and answer the section can assist in delivering.
Foremost this section aims to inform parties interested in sending or receiving tissue-culture material of clonal crops from a source outside the country i.e. international, trans-boundary movement. In this context we recognise an absolute requirement for the identification of all tissue-culture associated pests and application of analytical methods that give rigorous assurance on pest status. In all probability the user will have a zero tolerance for pests. In the context of the CGIAR germplams collections, zero tolerance of pests within the germplasms is a mandatory requirement.
However, the section can also be used to support tissue-culture multiplication for in-country dissemination. In this context the question may be different, in that rather than looking to test for all pests (some that will be over very low probability of presence if not reported in the country or region) a list of a few priority pests may be identified. This allows for country and regional differences to be prioritised over a global pest list.
A further facet of a question is the scale and level of assurance that is required. In testing a small number of tissue-culture plants sophisticated and highly sensitive analytical approaches may be affordable, but if these plant numbers are significant the pragmatics of scale and cost may point towards the use of other methods that are better suited to high throughput. Not invariably, but sometimes, the choice of method identifies with a trade-off on sensitivity to detect, and the user will need to weigh the risks associated with such an outcome.
Reviewing the choice of analytical approach may also identify that the user does not have access to the ‘best’ methods, but can do other methods which have been shown to be less suitable. This again requires the user to attribute what is acceptable risk in the choice of method taken and the required purpose.
In all the above scenarios, the section aims to give support in the users decision-making, not in making the decision, but n framing it and any uncertainty that resides about the choice and testing pathway taken.
Some limitations of the section and the need to share opinions
This resource, in its use, requires a level of expert knowledge in deciphering the risk associated with priority pests and the choices of analytical methods. It also accepted that for all the crops and pests that are likely to be identified the level of knowledge and uncertainty associated with potential harm (consequences of introduction) and efficacy of the analytical approach is uneven. Some pests are well described with a strong body of appropriate information and experience, whereas others are relatively undescribed and require decisions to be made without a wealth of experience to draw on. Likewise some pests, though well described, provide particularly challenging targets for diagnostics. Examples like Banana Streak Virus where there is integration of the virus into plant genomes is an evident example. Likewise the need to detect satellites of Cassava Mosaic Disease presents a subjective challenge.
To recognise these limitations is not weakness, but to identify future strengths and if the section can form a background for greater debate on the risks associated with pests then it will have served a substantial purpose. We encourage you to work collectively, to share ideas and to develop the best systems as meets your needs.
References and further reading
Bradbury JF. 1986. Guide to Plant Pathogenic Bacteria. CAB International.
CABI. http://www.cabi.org/. Date accessed 20 April 2010.
CABI Arthropod Name Index on CD-Rom. 1996. Gives information on synonyms and links to old Review of Applied Entomology volumes (including pre-1973).
CABI CPC. CABI Crop Protection Compendium. [online] Available from URL: http://www.cabi.org/compendia/cpc/ Date accessed 20 April 2010.
Carroll LE, White IM, Freidberg A, Norrbom AL, Dallwitz MJ, Thompson FC. 2004. Pest Fruit Flies of the World: Larvae. [online] Available from URL: http://delta-intkey.com/ffl/www/_wintro.htm Date accessed 20 April 2010.
DPV Web. Descriptions of plant viruses. EPPO PQR, 2005. EPPO Plant Quarantine Information Retrieval System, Version 4.6, 2007 1 Rue le Notre, 75016, Paris, France [online] Available from URL: http://www.dpvweb.net/ Date accessed 20 April 2010.
Esser RP. 1991. A computer ready check list of the genera and species of phytoparasitic nematodes including a list of mnemonically coded subject categories. Florida Dept. of Agriculture and Consumer services, 185 pp.
Evans K, Trudgill DL, Webster JM, editors. 1993. Plant parasitic nematodes in temperate agriculture. CAB International, Wallingford, 648 pp.
Farr DF, Rossman AY, Palm ME, McCray EB. undated. Fungal Databases, Systematic Botany & Mycology Laboratory, ARS, USDA. [online] AVailable from URL: http://nt.ars-grin.gov/fungaldatabases/ Date accessed 24 July 2007.
Firrao G, Andersen M, Bertaccini A, Boudon E, Bove JM, Daire X, Davis RE, Fletcher J, Garnier M, Gibb KS, Gundersen-Rindal DE, Harrison N, Hiruki C, Kirkpatrick BC, Jones P, Kuske CR, Lee IM, Liefting L, Marcone C, Namba S, Schneider B, Sears BB, Seemuller E, Smart CD, Streten C, Wang K. 2004. 'Candidatus Phytoplasma', a taxon for the wall-less, non-helical prokaryotes that colonize plant phloem and insects. International Journal of Systematic and Evolutionary Microbiology 54, 1243-1255.
Hill DS. 1983. Agricultural Insect Pests of the Tropics and their control, 2nd Edition. Cambridge University Press, London, 746 pp.
Hill DS. 1987. Agricultural Insect Pests of Temperate Regions and their control. Cambridge University Press, London, 660 pp.
ICTVdb. The Universal Virus Database of the International Committee on Taxonomy of Viruses. Colombia University. [online] Available from URL: www.ncbi.nlm.nih.gov/ICTVdb/ Date accessed 20 April 2010.
Index Fungorum Partnership. 2004. Index fungorum. [online] Available from URL: http://www.indexfungorum.org/NAMES/NAMES.asp Date accessed 20 April 2010.
Jeffries CJ. 1998. Potato: FAO/IPGRI Technical guidelines for the safe movement of potato germplasm. International Plant Genetic Resources Institute. Rome, Italy. Available here (1.9 MB)
Jeppson LR, Keiffer HH, Baker EW. 1975. Mites Injurious to Economic Plants, University of California Press, Berkley, 614 pp.
Kirk PM, Cannon PF, Stalpers JA, editors. 2008. Dictionary of the Fungi, 10th Edition.
Luc M, Sikora RA, Bridge J, editors. 2005. Plant Parasitic Nematodes in Subtropical and tropical Agriculture. CAB International,
National History Museum. 2010. The Global Lepidoptera Names Index. [online] Available from URL: http://www.nhm.ac.uk/research-curation/projects/lepindex/ Date accessed 20 April 2010.
ProMed Mail [online]. Available from URL: http://www.promedmail.org/ Date accessed 20 April 2010.
ScaleNet. All about scale insects. http://www.sel.barc.usda.gov/scalenet/query.htm Date accessed 20 April 2010.
Smith IM, Dunez J, Lelliott RA, Phillips DH, Archer SA. 1988. European Handbook of Plant Diseases. Blackwell Scientific Publications,
The American Phytopathological Society. Plant Disease Notes: An International Journal of Applied Plant Pathology. ASPnet [online] Available from URL: http://www.apsnet.org/pd/ Date accessed 20 April 2010.
Waller JM. 2002. Regional and country lists of plant diseases pp 287-308. In: Waller JM, Lenne JM, Waller SJ, editors. Plant Pathologist’s Pocketbook. CAB International 2002, 516 pp.
Pest list identification and prioritization
Contributors to this section: CIP, Lima, Peru (Carols Chuquillanqui, Segundo Fuentes, Ivan Manrique, Giovanna Muller, Willmer Pérez, Reinhard Simon, David Tay); CIP, Nairobi, Kenya (Ian Barker); FERA, UK (Derek Tomlinson, Julian Smith, David Galsworthy, James Woodhall).
How to develope a pest list appropriate to vegetatively propagated plants in tissue culture
The word 'pest' here is as defined in the International Plant Protection Convention IPPC). It encompasses all harmful biotic agents ranging from viroids to weeds and Living Modified Organisms (LMOs).
The production of a pest list is essential to support and facilitate the movement of plant germplasm between countries. The production of such lists is in accordance with the International Plant Protection Convention (IPPC) principles of transparency and cooperation and helps importing countries assess the risk involved in the importation of the germplasm. Pest lists are simply lists of pests associated with a particular host or group of hosts. They may be related to any defined geographical are but most are global, regional or national in perspective.
When considering movement of germplasm in tissue culture the pest list can be narrowed down considerably to include only those organisms that present a risk in tissue culture material. These include viruses, viroids, phytoplasmas and latent and nutritionally demanding bacteria.
Pest list initiation
A pest list should be obtained when a decision has been made to import a plant commodity. The type of material to be imported and the perceived risk of contamination by pests associated with that material will govern the detail required in the list. Thus vegetative propagating material (e.g. potato tubers, cassava cuttings, banana setts) will present a high risk of transmitting a wide range of pests, seeds will present a lower risk and tissue culture material will present the lowest risk. The list should include all the pests that could be introduced with the plant material being imported (see the prioritisation of pests in a pest list document).
Although the information required will vary the information usually required includes:
Scientific name of the pest
Common name of the pest
Synonyms
Former names
Presence or absence in the importing country
Presence or absence in the exporting country
Distribution in importing country
Distribution in exporting country
Quarantine listing by relevant national and regional plant protection organisations
Information that may also be useful to include in the pest list includes:
Type of organism e.g. saprophyte/secondary pathogen/vector etc.
Notes on importance/risk of the pest
Plant part attacked
Symptoms
Likelihood of pest being carried on above ground plant parts
Likelihood of pest being carried on bare (soil free) roots
Likelihood of pest being carried with seed
At this stage it is useful to check with National Plant Protection Organisations of importing and exporting countries for existing pest lists for the plant host being imported as well as any synonyms of the host and closely related species if there is a chance of important pests switching hosts in the countries (or in-country areas) under consideration. Life stages of the plant host may also need to be considered.
Information sources
A first priority is to check plant disease records for the local and exporting country. Available scientific reports, annual and other reports from agricultural research stations and plant health authorities should also be consulted when available. Information may also be obtainable from the regional plant protection organisation covering the countries involved in the transfer of the plant material. Contact details for both national and regional plant protection organisations are available on the IPPC website (www. ippc.int). A list of regional plant protection organizations and their member countries is provided in Appendix 1. References to country and regional disease lists are available (Waller, 2002). However, it is then advisable to conduct a literature search even if pest lists are available for the plant host in the importing and exporting countries. The reason for this is that such lists are often infrequently updated and the pest situation can change within a short period of time (e.g. the increase in the number of recognised cassava mosaic geminiviruses in Africa over recent years).
Key information sources include American Phytopathological Society (APS), CAB abstracts, EPPO as well as more general internet searches (e.g. Google). Recent reviews or books dealing with pests of particular crops are especially useful and can be relatively easily located using internet searches of key words (e.g. viruses, cassava).
Useful starting points are the CABI Crop Protection Compendium and the CABI Forestry Compendium. Searching by host in these compendia can generate a crude list of pests associated with the host, which can then be augmented by searches on the EPPO PQR system. It is useful to include all known synonyms of the pest even if these have not been used for some time.
In some cases, it may be necessary to consider all organisms associated with a particular host and therefore, consideration must be given to whether it is a genuine pest, secondary pathogen or just an incidental record.
Searches on the APS website, CABI compendia and EPPO PQR will have generated a crude pest list. This needs to be divided into the following categories of organism: viruses and viroids, bacteria, phytoplasmas, fungi (including Oomycetes), arthropod pests and nematodes. Some organism groups may be ignored if it is considered that the risks associated with transmission in the material being shipped between countries is minimal (e.g. arthropod pests in tissue culture material). Special attention may need to be given to other groups which can readily be spread in this material (e.g, viruses, viroids, phytoplasmas and some bacteria in tissue culture material).
The ‘crude list’ will need to be augmented by specific searches for each pest group. Key sources for each group are listed below:
Pathogens - general
Pro-Med Plant Disease Reports (http://www.promedmail.org)
Viruses and viroids
ICTVdB (http://www.ncbi.nlm.nih.gov/)
DPV (http://www.dpvweb.net/)
Viroids (http://www.ncbi.nlm.nih.gov/genomes/genlist.cgi?taxid=12884&type=0&name=Viroids)
Bacteria
Bradbury, 1986.
The International Society of Plant Pathology (ISPP) (http://www.isppweb.org/).
Phytoplasmas
Old names as well as names under the revised nomenclature (Firrao et al. 2004) should be searched.
Fungi
Farr et al. (undated).
http://www.indexfungorum.org/
Dictionary of the Fungi, 10th Edition. 2008. Edited by Kirk PM, Cannon PF, Stalpers JA.
Arthropods
CABI Arthropod Name Index (1996)
Hill, 1983 – Tropical Pests
Hill, 1987 – Temperate Pests
Insects
Pest Fruit Flies of the World (http://delta-intkey.com/ffl/www/_wintro.htm)
Lepindex – Global Lepidoptera Names Index (http://www.nhm.ac.uk/research-curation/projects/lepindex/)
Scalenet (http://www.sel.barc.usda.gov/scalenet/query.htm)
Nematodes
Esser RP, 1991.
Luc et al. 2005.
Names of organisms change as more taxonomic information becomes available and so it is important to check the currently approved names of the organisms as well as all synonyms and obsolete names.
One useful general resource is the Catalogue of Life website (http://catalogueoflife.org) and (http://www.species2000.org/) which provides the currently accepted names for a wide range of organisms. Approved fungal names and synonyms are available on the Indexfungorum website (www.indexfungorum.org), whilst approved bacterial and phytoplasma names are available on the ISPP website (http://www.isppweb.org) and in Fiarro et al., (2004) respectively.
Testing
Contributors to this section: CIP, Lima, Peru (Carols Chuquillanqui, Segundo Fuentes, Ivan Manrique, Giovanna Muller, Willmer Pérez, Reinhard Simon, David Tay); CIP, Nairobi, Kenya (Ian Barker); FERA, UK (Derek Tomlinson, Julian Smith, David Galsworthy, Rebecca Weekes)
Ring testing
Proficiency testing
More Articles...
Subcategories
-
main
- Article Count:
- 11
-
Stog
- Article Count:
- 2
-
Stog-rice
- Article Count:
- 7
-
Stog-sorghum
- Article Count:
- 11
-
Stog-common-bean
- Article Count:
- 10
-
stog-forage-legume
- Article Count:
- 10
-
stog-forage-grass
- Article Count:
- 11
-
stog-maize
- Article Count:
- 9
-
stog-chickpea
- Article Count:
- 10
-
stog-millets
- Article Count:
- 12
-
stog-barley
- Article Count:
- 10
-
stog-groundnut
- Article Count:
- 9
-
stog-pigeon-pea
- Article Count:
- 8
-
stog-wheat
- Article Count:
- 10
-
stog-lentil
- Article Count:
- 9
-
stog-cowpea
- Article Count:
- 10
-
stog-faba-bean
- Article Count:
- 9
-
risk management
- Article Count:
- 4
-
decision support tool
- Article Count:
- 3
-
stog-clonal
- Article Count:
- 23
-
developing strategies
- Article Count:
- 4