


CGKB News and events Collecting
Chapter 6: Strategies for the collecting of wild species


Mauricio Parra-Quijano
Departamento de Biología Vegetal Universidad Politécnica de Madrid, Ciudad Universitaria Madrid, Spain
E-mail: mauricio.parra(at)agrobiodiversidad.org
José María Iriondo
Área de Biodiversidad y Conservación, Departamento de Biología y Geología Universidad Rey Juan Carlos, Madrid, Spain
E-mail: jose.iriondo(at)urjc.es
Elena Torres Lamas
Departamento de Biología Vegetal Universidad Politécnica de Madrid, Ciudad Universitaria Madrid, Spain
E-mail: elena.torres(at)upm.es
|
2011 version |
1995 version |
||
|
Open the full chapter in PDF format by clicking on the icon above. |
|||
.jpg)
This chapter is a synthesis of new knowledge, procedures, best practices and references for collecting plant diversity since the publication of the 1995 volume Collecting Plant Diversity: Technical Guidelines, edited by Luigi Guarino, V. Ramanatha Rao and Robert Reid, and published by CAB International on behalf of the International Plant Genetic Resources Institute (IPGRI) (now Bioversity International), the Food and Agriculture Organization of the United Nations (FAO), the World Conservation Union (IUCN) and the United Nations Environment Programme (UNEP). The original text for Chapter 6: Strategies for the Collecting of Wild Species, authored by R. von Bothmer and O. Seberg, has been made available online courtesy of CABI. The 2011 update of the Technical Guidelines, edited by L. Guarino, V. Ramanatha Rao and E. Goldberg, has been made available courtesy of Bioversity International.
Please send any comments on this chapter using the Comments feature at the bottom of this page. If you wish to contribute new content or references on the subject please do so here.
Back to list of chapters on collecting
Internet resources for this chapter
Abstract
 |
|
|
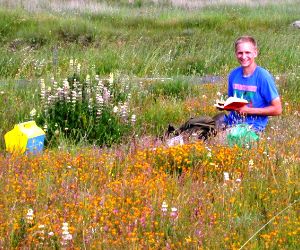
Collecting seeds from a population of Arabidopsis thaliana growing among a stand of Lupinus hispanicus subsp. bicolor, Barco de Avila, Spain, 2004. |
Crop wild relatives (CWR) have received increasing interest from the plant genetic resources community since the first Global Plan of Action in 1996 called attention on its poor representation in germplasm collections around the world. Collecting has become a strategic activity to improve the ex situ representation of wild germplasm, but improvements are now more focused on qualitative issues (i.e., introducing novel genetic diversity, useful traits, environmental adaptations) than being simply quantitative (i.e., aimed only at the number of accessions). Since the publication of these Technical Guidelines in 1995, there have been some significant technical and methodological advances in novel CWR collecting and evaluation of past collecting efforts.
In the last decade, several tools and methodologies that have been successfully tested in related disciplines (such as plant biology, ecology and biodiversity conservation) have been gradually introduced and/or popularized in plant genetic resources, such as the use of geographic information systems, ecogeographical analysis or species distribution models. Thus, current scientific knowledge and technical capabilities have allowed collecting missions for CWR following research or breeding interests to be carried out with “surgical” precision. Collecting for genetic diversity and/or conservation is the area where the new advances have been used more intensively, allowing for the design of effective and efficient collecting missions, the detection of collection biases in existing germplasm collections, the assessment of their representativeness and, therefore, the need for additional germplasm collecting.
The original version of this chapter (authored by von Bothmer and Seberg) provides an adequate framework for the integration and discussion of these new advances, and the identification of future challenges. This update presents the most significant contributions on CWR collecting that have taken place in the last 15 years. However, instead of keeping the focus on the tribe Triticeae of the Poaceae family as in the original chapter, it provides examples of a broad taxonomic range.
Introduction
Wild plant species, in a broad sense, are a relatively modern target in the history of plant genetic resources for food and agriculture (PGRFA). However, for those interested in the conservation and use of agricultural biodiversity, only some of the wild species that are genetically related to domesticated or cultivated species deserve major attention. They are referred as crop wild relatives (CWR) and include progenitors and other species belonging to the primary, secondary and tertiary genepools of crop species (Maxted et al. 2008b).
CWR are a valuable source of traits for resistance to and tolerance of biotic and abiotic stresses – traits that contributed to increases in yield and quality of about USD$350 million per year in the USA alone in the mid-1980s (Prescott-Allen and Prescott-Allen 1986). It can be assumed that this value has further increased in the last decades as we headed towards the current scenarios of global change. CWR became a matter of concern at a global scale when, at the end of the 1990s, the scientific community circulated several warnings about the risk of extinction of many CWR species and the consequent loss of useful genetic material. FAO’s Global Plan of Action (1996) provided one of the most important calls for attention to the low representation of CWR in ex situ germplasm collections and the need to collect them. Consequently, many organizations interested in PGRFA conservation have focused their efforts on improving the representation of CWR species in genebanks.
As the Second Report on the State of the World’s Plant Genetic Resources for Food and Agriculture (SoWPGR-2) notes, 240,000 new accessions were collected over the period 1996–2007, and approximately 40% of them were CWR (FAO 2010). This means that CWR were the predominant type of germplasm collected over the last 15 years. At the same time, SoWPGR-2 underlined the fact that most CWR germplasm was collected by crop genebanks as a matter of local or national interest. Some botanical gardens also operate seed banks and, therefore, collect seeds of wild plants (not only CWR), but there is no global data (on number of species and accessions) available about their conservation efforts. In addition, botanical gardens focus their attention mainly on threatened, rare or endemic wild plants (Bacchetta et al. 2008) and tend to represent species richness more than intraspecific genetic variation (Maunder et al. 2004).
Despite the increasing importance of CWR, information on CWR collecting is scarce and poorly represented in the scientific media. Scientific reports about collecting missions of plant genetic resources (PGR) are often undervalued and published just as “short communications” in most cases. Furthermore, most local/national initiatives involved in the collecting of CWR germplasm do not produce easily accessible outputs, and the results remain as grey literature or internal reports. As a result, CWR collecting expeditions are difficult to follow and quantify.
Fortunately, unlike the reports of collecting missions, some relevant collecting methodologies for PGR have been published in recent years, many of them focused on CWR. New, available methodologies are the result of previous joint developments, including recent advances in geographical information system (GIS) tools and data accessibility and sharing (through the internet). Progress in this area comes from individual and collaborative efforts involved in projects on CWR conservation (Heywood et al. 2007).
Most new advances on CWR collecting have considered representativeness as a main goal. In genetic terms, representativeness in ex situ conservation refers to the attempt to capture the genetic variability of the species to the greatest extent possible. However, until a complete view of the existing genetic variability across species is available, it is hardly possible to determine gaps in genetic representativeness (GR). The assessment of the genetic variability of all genebank samples of a particular species might be affordable but it would be difficult to achieve this for all the populations of the species. For this reason, most advances have focused on assessing ecogeographical representativeness (ER) as a surrogate of GR. Because there is a link between genotype or phenotype and environmental conditions (because of the selective pressures and local adaptation processes that affect wild populations) the use of ecogeographical data as a surrogate of genetic data can be justified. These relationships have been addressed by several authors, such as Steiner (1999), and supported by a constant number of publications over time (see, for example, the review for Triticum wild relative species by Nevo [2011]). In addition to this, the advantages of using ER are linked to the low information requirements about the target species’ populations. Georeferenced collecting sites are the baseline of any ecogeographical study in PGR, and geographic coordinates are the most appropriate data to define unequivocally any collecting site (Hijmans et al. 1999). When collecting is carried out following ER parameters, the principle is simple: sampling CWR of distinct ecogeographical areas should ensure sampling of representative intraspecific genetic variation (Greene and Hart 1999; Jones et al. 1997; Parra-Quijano et al. 2008; Steiner and Greene 1996).
Collecting CWR following representativeness criteria is obviously carried out within the framework of “collecting for genetic diversity study and conservation”, as established in the original chapter in 1995. For other collecting alternatives (i.e., collecting for specific use in breeding programmes or for taxonomic/phylogenetic/biosystematics research), the most significant innovations also come from similar methodologies and tools (GIS, ecogeographical approach or species distribution models).
 |
|
|
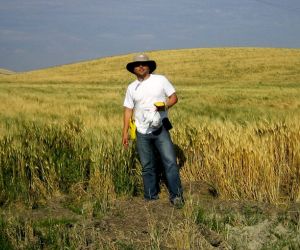
Collecting wild relatives of a legume (Lupinus spp) at the edge of a cereal field in Cadiz, Spain. Collecting design was optimized and location data loaded into the GPS unit the collector is holding. (Photo: M.P. Quijano) |
Current Status
In this section, the most remarkable advances in CWR collecting methods published in the last 15 years are briefly described, following the structure of the original 1995 chapter.
Collecting for taxonomic, phylogenetic and biosystematics research
There are few publications on expeditions for CWR collecting following these interests, although some remarkable examples can be cited, such as the continued efforts on collecting wild relatives of Solanum tuberosum by Spooner et al. (1992, 1994, 2000). These articles describe exploration criteria, routes, taxonomic and/or phylogenetic interests and collecting results in Ecuador, Bolivia and Mexico in detail.
On the other hand, van Treuren et al. (2011) nicely showed how to use passport data from PGR documentation systems and other sources to determine collection gaps in crop and wild leafy vegetable species based on the genepool structure of the target crop species.
Collecting for taxonomic research frequently demands drawing the distribution of known species and assessing species richness in the territory of study. In this sense, Hijmans and Spooner (2001) established the geographic distribution of about 199 wild potato species and determined the areas with the highest species richness. This work was supported by GIS tools. Similarly, Sawkins et al. (1999) analysed the case of some Stylosanthes species, where, in addition to using GIS tools, they introduced a predictive distribution model (based on Principal Component Analysis) to estimate the potential distributions of these taxa.
In other cases, the objective (besides mapping species distribution) has been to identify environmental adaptations and/or climatic ranges for sets of CWR species. Segura et al. (2003) linked the distributions of five Passiflora species to several temperature and rainfall variables through GIS tools and species distribution models. With this information about species adaptation, they planned ex situ and in situ conservation strategies. Similarly, Ferguson et al. (2005) used GIS tools, species distribution models and climatic variables to study the biogeography of 69 wild Arachis species. These kinds of studies are also helpful for meeting the objectives of the types of collecting interests that are presented next.
Collecting for genetic diversity study and conservation
“Capture of genetic diversity” commonly refers to between- and within-population sampling procedures within a species. Molecular methods for characterizing genetic diversity developed enormously since 1995, and techniques such as ISSRs, microsatellites or AFLPs, which were not mentioned in the 1995 version of this chapter, have been extensively applied (Spooner et al. 2005). Nevertheless, at this level, collecting strategies in wild species is still a matter of determining the size of the sample per site (population/subpopulation) and the number of sites that need to be sampled to ensure appropriate allelic retention (Brown and Briggs 1991). Sampling theory on collecting PGR was extensively detailed by Brown and Marshall (1995) in chapter 5 of "Collecting Plant Genetic Diversity: Technical Guidelines", as well as by von Bothmer and Seberg in the 1995 version of this chapter. Since then, there have been few new developments. For instance, optimum sample size has been documented for some species, e.g., wild populations of Phaseolus lunatus (Zoro Bi et al. 1998) or Zizania texana (Richards et al. 2007), while other studies have explored different models to determine minimum sample size under specific conditions (e.g., ploidy level, matting system or multiple loci) (Sapra et al. 1998; Lockwood et al. 2007).
In spite of the extraordinary advances of molecular methods for characterizing genetic diversity, when it comes to planning the collection of seeds of target CWR for PGR conservation, the norm is that there are no previous genetic diversity data published on the target species or that published data are inadequate. Therefore, in most cases, it is not possible to rely on such data to design the sampling strategy. Even if the genetic diversity of the species has been previously studied, it should be noted that neutral genetic variation, as characterized using current widespread molecular techniques, does not necessarily correlate with adaptive genetic variation, which is the type of genetic variation that is of greatest interest for breeding purposes. In this regard, the studies performed by Storfer (1996), Pfrender et al. (2000) and Bekessy et al. (2003), among others, show that currently used molecular markers are not associated with genes of adaptive value and that the correlation between the indicators of diversity obtained in the two types of genes is usually low.
Concerning the use of ecogeographical data as a proxy for data on genetic diversity, in chapter 15 of the 1995 edition of "Collecting Plant Genetic Diversity: Technical Guidelines", Guarino (1995b) mentioned the potential of GIS tools in PGR collecting activities for the first time, and Greene et al. (1999a, 1999b) described the first case of the use of GIS tools in sampling intraspecific variation in CWR species of Trifolium, Lotus and Medicago. Afonin and Greene (1999) published a detailed description of the use of GIS in the design of CWR collecting. They focused their attention on the possible uses of GIS to (1) determine where to search through the use of predictive models, (2) determine where to search to collect germplasm adapted to abiotic stresses, (3) define a sampling framework and (4) assess the anthropogenic influence on target sampling areas.
Another important advance, also based on GIS techniques, was presented by Hijmans et al. (2000), concerning the identification of collecting biases in wild potato samples from Bolivia conserved in the world’s six main wild potato genebanks. Four types of bias were described: species, species-area, hotspot and infrastructure bias. Knowledge about the type and magnitude of collecting biases is relevant information that should always be taken into account when improving the representativeness of any genebank and designing new collecting expeditions.
Gap analysis is a comparative method that can be used to improve biodiversity conservation (Maxted et al. 2008a) and, specifically, to improve the efficiency in CWR collecting activities. Recently, Ramírez-Villegas et al. (2010) described the use of gap analysis to prioritize geographic areas for collecting wild Phaseolus species. This methodology has been used to determine “potential” gaps in several CWR species (see http://gisweb.ciat.cgiar.org/GapAnalysis). Whale potential gaps come from comparisons between collecting sites of germplasm that is already conserved (genebank data) and species distribution models, a “classic” gap analysis compares genebank collecting sites with data on species occurrence from other sources, such as herbaria, botanical databases and other types of presence data (see Parra-Quijano et al. 2008). Another example of the use of species distribution models in collecting CWR can be found in the case of Vasconcellea in Venezuela (Rodríguez et al. 2005).
The basis of ER studies in CWR ex situ germplasm collections is described by Parra-Quijano et al. (2008). The ER studies use gap-analysis techniques and ecogeographical characterization data to determine which areas should be explored to find and collect populations that grow in underrepresented environments. Ecogeographical characterization of the collection sites (Steiner and Greene 1996) or the territory where the target taxon occurs (Parra-Quijano et al. 2011a) is essential to ER analysis in genebanks. Ecogeographical variables are the first element to be considered. There are currently hundreds of ecogeographical variables available (in GIS layer format) for most countries, but only some of them might have a significant influence on the abiotic adaptation of the target species. Thus, Bennett and Bullita (2003) determined the most influential ecogeographical variables in six species of Trifolium collected in Sardinia.
Based on these premises, an optimized PGR collecting method has been described by Parra-Quijano et al. (2011b). This method was developed and validated in six Lupinus species (five CWR and one cultivated) in Spain. Optimized collection attempts to make collecting activities and field exploration as efficient as possible, combining spatial and ecogeographical gap analysis, species distribution models and GIS tools. Thus, optimized collecting designs will guide explorers in finding and collecting populations in underrepresented environments (from spatial and ecogeographical points of view). At this point, two possible cases of optimized collections that follow representativeness criteria can be identified: (1) collecting a CWR species that is already represented in the genebank and (2) collecting a new species that has no previous accessions in the genebank. The Lupinus example mentioned above belongs to the first case, since the objective there was to improve the ER of the Spanish Lupinus collection held by the Plant Genetic Resources Centre of the National Institute of Agriculture and Food Research (CRF-INIA). Based on similar ER principles, Ghamkhar et al. (2007) determined ecogeographical regions and subregions within the Mediterranean and Irano-Turanian ecoregions related to Trifolium spumosum adaptations and then identified areas to explore to fill gaps in the collection of the Australian Trifolium Genetic Resources Centre (ATGRC).
Some CWR species may stand out because of their rarity or threat degree, and seed collecting may be called for as part of the effort to conserve the species. This is the case of Capsicum flexuosum, a rare and endangered species that has low representation in Capsicum genebanks. In this context, Jarvis et al. (2005) developed a successful collecting strategy for sampling C. flexuosum in some areas of Paraguay, based on GIS and species distribution models.
Collecting for immediate use in a breeding programme
Reports for this type of collecting are scarce and difficult to find. This is in part due to the fact that breeding programmes are often conducted by private companies, which are zealous about not disclosing their activities and sources of germplasm. However, it is important to note that collecting expeditions that try to capture genetic diversity are frequently biased towards breeders’ interests since the ultimate goal of PGR conservation is the utilization of its resources.
The most novel strategy for collecting CWR for immediate use in a breeding programme is emerging from an extension of the focused identification germplasm strategy (FIGS) that originated as a way of selecting subsets of germplasm from genetic resource collections in such a way as to maximize the likelihood of capturing a specific trait at a higher frequency than if the subset were selected at random. This approach was initially presented as a core collection sampling strategy (Mackay 1986, 1990), but later, it was further developed (Mackay and Street 2004) to meet the needs of a plant breeder approaching a genebank for sources of genetic diversity for crop breeding programmes aimed at a specific trait. If we look at CWR populations in their natural habitats, the FIGS approach can be used to select the populations where seeds should be collected in order to maximize the likelihood of capturing the desired trait. In essence, this method can guide field explorations to populations exposed to specific environmental stresses of interest to breeders. This methodology is currently being tested in the context of the PGR Secure project (www.pgrsecure.org).
Future challenges/needs/gaps
Future predictable advances and their consequences in regard to CWR collecting activities can be listed as follows:
1. Presence data on CWR species will become more abundant, detailed and easily available, particularly data from hotspot areas and centres of crop origins and diversity. They will be useful for performing more accurate CWR gap analyses and for implementingoptimized collecting activities more efficiently.
2. Ecogeographical data in GIS layer format will improve in quality and resolution, and will be more easily available. This will allow ecogeographical representativeness studies to be performed – even at the within-population level – in the coming years.
3. Optimized methods of spatial interpolation of genetic diversity data will allow this information to be used as conventional GIS layers and will help improve the collection of genetic diversity in the field.
4. The development and popularization of non-neutral genetic markers linked to adaptive traits will enable a direct measure of the type of genetic variation that is sought for conservation in genebanks and use in breeding programmes. This will allow a much better assessment of the genetic diversity already stored in genebanks and will facilitate the design of more-efficient seed collecting strategies. It will also help calibrate the link with ecogeographical variables.
Conclusions
A significant change since the Technical Guidelines were published in 1995 is that CWR species conservation is now one of the highest priorities in plant genetic resources. Fifteen years ago, CWR was barely a rising topic. Several reasons for this huge change can be argued: the need for novel genes, the need of crop adaptation to extreme conditions, the breakdown of barriers to introgression, the increasing pressure on wild species populations brought about by global changes, and a growing awareness of the false sense of getting the job done with cultivated species. Although the effective conservation of CWR is the goal, lessons from cultivated plants have led to a focus on how to collect the most representative and useful germplasm of wild species.
Wild plant species are a target shared with other disciplines, such as biological conservation or plant ecology, so some of their tested tools have been gradually transferred to make possible the development of efficient methodologies for collecting CWR. As a result, a new range of methodological approaches based on ecogeographical data and plant adaptation is now available. GIS tools have provided a solid vehicle for facilitating the implementation and popularization of these methodologies. Their potential role in collecting plant genetic resources was highlighted by Guarino (1995a) in chapter 16 of these Technical Guidelines. Although genotypic and phenotypic approaches have also undergone significant changes (i.e., development of genomics, proteomics, new molecular markers, etc.), their effects have not been highly influential in the development of new strategies for collecting wild species.
Back to list of chapters on collecting
References and further reading
Afonin A, Greene SL. 1999. Germplasm collecting using modern geographic information technologies: directions explored by the N.I. Vavilov Institute of Plant Industry. In: Greene SL, Guarino L, editors. Linking Genetic Resources and Geography: Emerging Strategies for Conserving and Using Crop Biodiversity. CSSA Special Publication 27. American Society of Agronomy, Madison, Wisconsin. pp.75–85.
Bacchetta G, Bueno A, Fenu G, Jiménez-Alfaro B, Mattana E, Piotto B, Virevaire M. 2008. Conservación Ex Situ De Plantas Silvestres. Gobierno del Principado de Asturias, Obra Social La Caixa, Oviedo, Spain.
Bekessy SA, Ennos RA, Burgman MA, Newton AC, Ades PK. 2003. Neutral DNA markers fail to detect genetic divergence in an ecologically important trait. Biological Conservation 110(2):267–275.
Bennett SJ, Bullitta S. 2003. Ecogeographical analysis of the distribution of six Trifolium species in Sardinia. Biodiversity and Conservation 12(7):1455–1466.
Brown AHD, Briggs JD. 1991. Sampling strategies for genetic variation in ex situ collections of endangered plant species. In: Falk DA, Holsinger KE, editors. Genetics and Conservation of Rare Plants. Oxford University Press, New York. pp.99–119.
Brown AHD, Marshall DR. 1995. A basic sampling strategy: theory and practice. In: Guarino L, Ramanatha Rao V, Reid R, editors. Collecting Plant Genetic Diversity: Technical Guidelines. CAB International, Wallingford, UK. pp.75–91.
FAO. 1996. Global Plan of Action for the Conservation and Sustainable Utilization of Plant Genetic Resources for Food and Agriculture and the Leipzig Declaration. Food and Agriculture Organization of the United Nations, Rome. Available online (accessed 28 October 2011): http://typo3.fao.org/fileadmin/templates/agphome/documents/PGR/GPA/gpaeng.pdf.
FAO. 2010. The Second Report on the State of the World's Plant Genetic Resources for Food and Agriculture. Food and Agriculture Organization of the United Nations, Rome. Available online (accessed 28 October 2011): www.fao.org/agriculture/crops/core-themes/theme/seeds-pgr/sow/sow2/en.
Ferguson ME, Jarvis A, Stalker HT, Williams DE, Guarino L, Valls JFM, Pittman RN, Simpson CE, Bramel PJ. 2005. Biogeography of wild Arachis (Leguminosae): distribution and environmental characterisation. Biodiversity and Conservation 14(7):1777–1798.
Ghamkhar K, Snowball R, Bennett SJ. 2007. Ecogeographical studies identify diversity and potential gaps in the largest germplasm collection of bladder clover (Trifolium spumosum L.). Australian Journal of Agricultural Research 58(7):728–738.
Greene SL, Hart TC. 1999. Implementing a geographic analysis in germplasm conservation. In: Greene SL, Guarino L, editors. Linking Genetic Resources and Geography: Emerging Strategies for Conserving and Using Crop Biodiversity. CSSA Special Publication 27. American Society of Agronomy, Madison, Wisconsin. pp.25–38.
Greene SL, Hart TC, Afonin A. 1999a. Using geographic information to acquire wild crop germplasm for ex situ collections: I. map development and field use. Crop Science 39(3):836–842.
Greene SL, Hart TC, Afonin A. 1999b. Using geographic information to acquire wild crop germplasm for ex situ collections: II. post-collection analysis. Crop Science 39(3):843–849.
Guarino L. 1995a. Geographic information systems and remote sensing for plant germplasm collectors. In: Guarino L, Ramanatha Rao V, Reid R, editors. Collecting Plant Genetic Diversity Technical Guidelines. CAB International, Wallingford, UK. pp.315–327.
Guarino L. 1995b. Mapping the ecogeographic distribution of biodiversity. In: Guarino L, Ramanatha Rao V, Reid R, editors. Collecting Plant Genetic Diversity Technical Guidelines. CAB International, Wallingford, UK. pp.287–327.
Heywood V, Casas A, Ford-Lloyd BV, Kell S, Maxted N. 2007. Conservation and sustainable use of crop wild relatives. Agriculture, Ecosystems & Environment 121(3):245–255.
Hijmans RJ, Spooner DM. 2001. Geographic distribution of wild potato species. American Journal of Botany 88(11):2101–2112.
Hijmans RJ, Schreuder M, De la Cruz J, Guarino L. 1999. Using GIS to check co-ordinates of genebank accessions. Genetics Resources and Crop Evolution 46(3):291–296.
Hijmans RJ, Garrett KA, Huamán Z, Zhang DP, Schreuder M, Bonierbale M. 2000. Assessing the geographic representativeness of genebank collections: the case of Bolivian wild potatoes. Conservation Biology 14(6):1755–1765.
Jarvis A, Williams K, Williams D, Guarino L, Caballero PJ, Mottram G. 2005. Use of GIS for optimizing a collecting mission for a rare wild pepper (Capsicum flexuosum Sendtn.) in Paraguay. Genetics Resources and Crop Evolution 52(6):671–682.
Jones PG, Beebe SE, Tohme J, Galwey NW. 1997. The use of geographical information systems in biodiversity exploration and conservation. Biodiversity and Conservation 6(7):947–958.
Lockwood DR, Richards CM, Volk GM. 2007. Probabilistic models for collecting genetic diversity: comparisons, caveats, and limitations. Crop Science 47(2):861–868.
Mackay MC. 1986. Utilizing wheat genetic resources in Australia. In: McLean R, editor. Proceedings of the 5th Assembly, Wheat Breeding Society of Australia. Western Australian Department of Agriculture, Perth, Australia. pp.56–61.
Mackay MC. 1990. Strategic planning for effective evaluation of plant germplasm. In: Srivastava JP, Damania AB, editors. Wheat Genetic Resources: Meeting Diverse Needs. John Wiley & Sons, Chichester, UK. pp.21–25.
Mackay MC, Street K. 2004. Focused identification of germplasm strategy – FIGS. In: Black CK, Panozzo JF, Rebetzke GJ, editors. Proceedings of the 54th Australian Cereal Chemistry Conference and the 11th Wheat Breeders' Assembly. Royal Australian Chemical Institute, Melbourne. pp.138–141.
Maunder M, Havens K, Guerrant EO Jr, Falk DA. 2004. Ex situ methods: a vital but underused set of conservation resources. In: Guerrant Jr. EO, Havens K, Maunder M, editors. Ex situ Plant Conservation. Supporting Species Survival in the Wild. Island Press, Washington, USA. pp. 3–20.
Maxted N, Dulloo E, Ford-Lloyd BV, Iriondo JM, Jarvis A. 2008a. Gap analysis: a tool for complementary genetic conservation assessment. Diversity and Distributions 14(6):1018–1030.
Maxted N, Kell SP, Ford-Lloyd BV. 2008b. Crop wild relative conservation and use: establishing the context. In: Maxted N, Ford-Lloyd BV, Kell SP, Iriondo JM, Dulloo E, Turok J, editors. Crop Wild Relative Conservation and Use. CAB International, Wallingford, UK. pp.3–30.
Nevo E. 2011. Triticum. In: Kole C, editor. Wild Crop Relatives: Genomic and Breeding Resources. Cereals. Springer-Verlag, Heidelberg, Germany. pp.407–456.
Parra-Quijano M, Draper D, Torres E, Iriondo JM. 2008. Ecogeographical representativeness in crop wild relative ex situ collections. In: Maxted N, Ford-Lloyd BV, Kell SP, Iriondo JM, Dulloo ME, Turok J, editors. Crop Wild Relative Conservation and Use. CAB International, Wallingford, UK. pp.249–273.
Parra-Quijano M, Iriondo JM, Torres E. 2011a. Ecogeographical land characterization maps as a tool for assessing plant adaptation and their implications in agrobiodiversity studies. Genetic Resources and Crop Evolution DOI 10.1007/s10722-011-9676-7.
Parra-Quijano M, Iriondo JM, Torres E. 2011b. Improving representativeness of genebank collections through species distribution models, gap analysis and ecogeographical maps. Biodiversity and Conservation DOI 10.1007/s10531-011-0167-0.
Pfrender ME, Spitze K, Hicks J, Morgan K, Latta L, Lynch M. 2000. Lack of concordance between genetic diversity estimates at the molecular and quantitative-trait levels. Conservation Genetics 1(3):263–269.
Prescott-Allen R, Prescott-Allen C. 1986. The First Resource: Wild Species in the North American Economy. Yale University Press, New Haven, Connecticut.
Ramírez-Villegas J, Khoury C, Jarvis A, Debouck DG, Guarino L. 2010. A gap analysis methodology for collecting crop genepools: a case study with Phaseolus beans. PLoS ONE 5(10):e13497. Available online (accessed 28 October 2011): http://www.plosone.org/article/info%3Adoi%2F10.1371%2Fjournal.pone.0013497.
Richards CM, Antolin MF, Reilley A, Poole J, Walters C. 2007. Capturing genetic diversity of wild populations for ex situ conservation: Texas wild rice (Zizania texana) as a model. Genetic Resources and Crop Evolution 54(4):837–848.
Rodríguez D, Marín C, Quecan H, Ortiz R. 2005. Áreas potenciales para colectas del género Vasconcellea Badillo en Venezuela. Bioagro 17(1):3–10.
Sapra RL, Narain P, Chauhan SVS. 1998. A general model for sample size determination for collecting germplasm. Journal of Biosciences 23(5):647–652.
Sawkins MC, Maxted N, Jones PG, Smith R, Guarino L. 1999. Predicting species distributions using environmental data: case studies using Stylosanthes Sw. In: Greene SL, Guarino L, editors. Linking Genetic Resources and Geography: Emerging Strategies for Conserving and Using Crop Biodiversity. CSSA Special Publication 27. American Society of Agronomy, Madison, Wisconsin. pp.87–99.
Segura S, Coppens d'Eeckenbrugge G, López L, Grum M, Guarino L. 2003. Mapping the potential distribution of five species of Passiflora in Andean countries. Genetic Resources and Crop Evolution 50(6):555–566.
Spooner DM, Castillo R, López LJ. 1992. Ecuador, 1991 potato germplasm collecting expedition: taxonomy and new germplasm resources. Euphytica 60(3):159–169.
Spooner DM, Berg RG, García W, Ugarte ML. 1994. Bolivia potato germplasm collecting expeditions 1993, 1994: taxonomy and new germplasm resources. Euphytica 79(1-2):137–148.
Spooner DM, Rivera-Peña A, van den Berg RG, Schüler K. 2000. Potato germplasm collecting expedition to Mexico in 1997: taxonomy and new germplasm resources. American Journal of Potato Research 77(4):261–270.
Spooner D, van Treuren R, de Vicente MC. 2005. Molecular Markers for Genebank Management. International Plant Genetic Resources Institute (IPGRI), Rome.
Steiner JJ. 1999. Exploring the relationship of plant genotype and phenotype to ecogeography. In: Greene SL, Guarino L, editors. Linking Genetic Resources and Geography: Emerging Strategies for Conserving and Using Crop Biodiversity. CSSA Special Publication 27. American Society of Agronomy, Madison, Wisconsin. pp.39–50.
Steiner JJ, Greene SL. 1996. Proposed ecological descriptors and their utility for plant germplasm collections. Crop Science 36(2):439–451.
Storfer A. 1996. Quantitative genetics: a promising approach for the assessment of genetic variation in endangered species. Trends in Ecology & Evolution 11(8):343–348.
van Treuren R, Coquin P, Lohwasser U. 2011. Genetic resources collections of leafy vegetables (lettuce, spinach, chicory, artichoke, asparagus, lamb's lettuce, rhubarb and rocket salad): composition and gaps. Genetics Resources and Crop Evolution DOI 10.1007/s10722-011-9738-x.
Zoro Bi I, Maquet A, Degreef J, Wathelet B, Baudoin JP. 1998. Sample size for collecting seeds in germplasm conservation: the case of the Lima bean (Phaseolus lunatus L.). Theoretical and Applied Genetics 97(1–2):187–194.
AEGRO website: http://aegro.jki.bund.de/aegro
Bioversity Crop Wild Relatives Global Portal: www.cropwildrelatives.org
Crop Wild Relative Information System (CWRIS): http://aegro.jki.bund.de/aegro/index.php?id=168
European Crop Wild Relative Diversity Assessment and Conservation Forum: http://pgrforum.org
FAO Facilitating Mechanism for the implementation of the Global Plan of Action, Portal for Plant Genetic Resources for Food and Agriculture: www.globalplanofaction.org
FAO Global Plan of Action (full text from1996): http://typo3.fao.org/fileadmin/templates/agphome/documents/PGR/GPA/gpaeng.pdf
FAO, The State of the World’s Plant Genetic Resources for Food and Agriculture: www.fao.org/agriculture/crops/core-themes/theme/seeds-pgr/sow/en
FAO, The Second Report on the State of the World’s Plant Genetic Resources (SoWPGR-2): www.fao.org/agriculture/crops/core-themes/theme/seeds-pgr/sow/sow2/en
GapAnalysis: http://gisweb.ciat.cgiar.org/GapAnalysis
Genetic Reserve Information System (GenResIS): www.agrobiodiversidad.org/aegro
Global Biodiversity Information Facility (GBIF): www.gbif.org
PGR Secure: www.pgrsecure.org
*Note that additional internet resources related to this chapter can be found in the update of chapter 15/16.
Chapter 5: Basic sampling strategies: theory and practice
Jose Crossa
Biometrics and Statistics Unit, International Maize and Wheat Improvement Center (CIMMYT), 06600 Mexico, DF, Mexico
E-mail: j.crossa(at)cgiar.org
Roland Vencovsky
Dept. of Genetics ESALQ/Universidade de Sao Paulo, Piracicaba, Sao Paulo, Brazil
E-mail: rvencovs(at)esalq.usp.br
|
2011 version |
1995 version |
||
|
Open the full chapter in PDF format by clicking on the icon above. |
|||
This chapter is a synthesis of new knowledge, procedures, best practices and references for collecting plant diversity since the publication of the 1995 volume Collecting Plant Diversity: Technical Guidelines, edited by Luigi Guarino, V. Ramanatha Rao and Robert Reid, and published by CAB International on behalf of the International Plant Genetic Resources Institute (IPGRI) (now Bioversity International), the Food and Agriculture Organization of the United Nations (FAO), the World Conservation Union (IUCN) and the United Nations Environment Programme (UNEP). The original text for Chapter 5: A Basic Sampling Strategy: Theory and Practice, authored by A. H. D. Brown and D. R. Marshall, has been made available online courtesy of CABI. The 2011 update of the Technical Guidelines, edited by L. Guarino, V. Ramanatha Rao and E. Goldberg, has been made available courtesy of Bioversity International.
Please send any comments on this chapter using the Comments feature at the bottom of this page. If you wish to contribute new content or references on the subject please do so here.
Back to list of chapters on collecting
Internet resources for this chapter
Abstract
Programmes for conserving genetic resources have collected, received and stored hundreds of thousands of accessions of different cultivated species and their wild and weedy relatives. Collection and regeneration protocols must consider the species (i.e., allogamous, partially allogamous, autogamous and dioecious) to ensure that the sample is representative of the population. Previous studies have used allelic richness as the basic parameter for determining sample sizes for genetic resource conservation. The concept of variance effective population size is important to the measurement of genetic representativeness and has been successfully used in genetic conservation (regeneration and collection). The aim of this chapter is to show how to practically apply the theory developed earlier and to demonstrate its use for answering practical questions that a manager of genetic resource conservation might pose when collecting and regenerating plant genetic resources. This chapter explains strategies for determining efficient sample size in order to maintain the representativeness of the original diversity when collecting and regenerating genetic resources.
[Download the PDF file for full text of updated version of Chapter 5 here]
Back to list of chapters on collecting
References and further reading
Allard RW. 1970. Population structure and sampling methods. In: Frankel OH, Bennett E, editors. Genetic Resources in Plants: Their Exploration and Conservation. Blackwell Scientific Publications, Oxford, UK. pp.97–107.
Bandel G, Gurgel JTA. 1967. Proporção do sexo em Pinheiro Brasileiro Araucaria angustifolia (Bert.) O. Ktze. Rev. Tec. Serv. Florestal do Est. de S. Paulo. Secr. Agr. Est. S. Paulo 6: 209–220.
Barret SCH, Yakimowsky SB, Field DL, Pickup M. 2010. Ecological genetics of sex ratios in plant populations. Philosophical Transactions of the Royal Society B. 365:2549–2557.
Bawa KS. 1974. Breeding systems of tree species of a lowland tropical community. Evolution 28(1):85–92.
Bawa KS. 1980. Evolution of dioecy in flowering plants. Annual Review of Ecology, Evolution, and Systematics 11:15–39.
Bawa KS, Perry DR, Beach JH. 1985. Reproductive biology of tropical lowland rain forest. I. Sexual systems and incompatibility mechanisms. American Journal of Botany 72(3):331–345.
Cockerham CC. 1969. Variance of gene frequency. Evolution 23:72–84.
Cockerham CC, Weir BS. 1984. Covariances of relatives stemming from a population undergoing mixed self and random mating. Biometrics 40:157–164.
Crossa J, Vencovsky R. 1994. Implications of the variance effective population size on the genetic conservation of monoecious species. Theoretical and Applied Genetics 89:936–942.
Crossa J, Vencovsky R. 1997. Variance effective population size for two-stage sampling of monoecious species. Crop Science 37:14–26.
Crossa J, Vencovsky R. 1999. Sample size and variance effective population size for genetic conservation. Plant Genetic Resources Newsletter 119:15–25.
Crossa J, Hernandez CM, Bretting P, Eberhart SA, Taba S. 1993. Statistical genetic considerations for maintaining germplasm collections. Theoretical and Applied Genetics 86:673–678.
Crow JF, Denniston C. 1988. Inbreeding and variance effective numbers. Evolution 42(3):482–495.
Crow JF, Kimura M. 1970. An Introduction to Population Genetics Theory. Burgess Publishing, Minneapolis, Minnesota.
Hernandez CM, Crossa J. 1993. A program for estimating the optimum sample size for germplasm conservation. Journal of Heredity 84:1.
Marshall DR, Brown AHD. 1975. Optimum sampling strategies in genetic conservation. In: Frankel OH, Hawkes JG, editors. Crop Genetic Resources for Today and Tomorrow. Cambridge University Press, Cambridge, UK.
Matallana G, Wendt T, Araujo DSD, Scarano FR. 2005. High abundance of dioecious plants in a tropical coastal vegetation. American Journal of Botany 92(9):1513–1519.
Moran PAP. 1950. Notes on continuous stochastic phenomena. Biometrika 37:17–33.
Namkoong G. 1986. Sampling for germplasm collections. Horticultural Science 23(1):79–81.
Oliveira PE. 1996. Dioecy in the cerrado vegetation of Central Brazil. Flora 191:235–243.
Oliveira PE, Gibbs PE. 2000. Reproductive biology of woody plants in a cerrado community of Central Brazil. Flora 195:311–329.
Queenborough SA, Burslem DFRP, Garwood NC, Valencia R. 2007. Determinants of biased sex ratios and inter-sex cost of reproduction in dioecious tropical forest trees. American Journal of Botany 94(1):67–78.
Sebbenn AM. 2006. Sistema de reprodução em espécies tropicais e suas implicações para a seleção de árvores matrizes para reflorestamentos ambientais. In: Higa AR, Silva LD, editors. Pomares de Sementes de Espécies Florestais Nativas. Fundação de Pesquisas Florestais do Paraná (FUPEF), Curitiba, Brazil. pp.93–108.
Sokal RR, Oden NL. 1978a. Spatial autocorrelation in biology. 1. Methodology. Biological Journal of the Linnean Society 10:199–228.
Sokal RR, Oden NL. 1978b. Spatial autocorrelation in biology. 2. Some biological implications and four applications of evolutionary and ecological interest. Biological Journal of the Linnean Society 10:229–249.
Vencovsky R. 1978. Effective size of monoecious populations submitted to artificial selection. Brazilian Journal of Genetics 1(3):181–191.
Vencovsky R, Crossa J. 1999a. Variance effective population size under mixed self and random mating with applications to genetic conservation of species. Crop Science 39:1282–1294.
Vencovsky R, Crossa J. 1999b. Medidas de representatividad. Workshop O Melhoramento de Plantas na Virada do Milenio. Universidad Federal de Vicosa, MG, Brasil.
Vencovsky R, Crossa J. 2003. Measurements of representativeness used in genetic resource conservation and plant breeding. Crop Science 43:1912–1921. doi:10.2135/cropsci2003.1912.
Vencovsky R, Nass LL, Cordeiro CMT, Ferreira MAJF. 2007. Amostragem em recursos genéticos vegetais. In: Nass LL, editor. Recursos Genéticos Vegetais. Embrapa, Brasília.
Vencovsky R, Chavez L, Crossa J. 2011. Variance effective population size for dioecious species. Crop Science (in press).
Viegas MP, Silva CLSP, Moreira JP, Cardin LT, Azevedo VCR, Ciampi AY, Freitas MLM, Moraes MLT, Sebbenn AM. 2011. Diversidade genética e tamanho efetivo de duas populações de Myracrodruon urundeuva fr. all., sob conservação ex situ. Revista Árvore 35(4):769–779.
Weir BS. 1996. Genetic Data Analysis II - Methods for Discrete Population Genetic Data. Sinauer Associates, Sunderland, Massachusetts.
Wright S. 1931. Evolution in Mendelian populations. Genetics 16:97–159.
MLTR (Multilocos Mating System Program) by Kermit Ritlan (a computer programme for analysing marker data): http://genetics.forestry.ubc.ca/ritland/programs.html
Resources for obtaining measures of genetic divergence among collection sites or subpopulations of a species in a given ecogeographic region, and of the level of natural inbreeding:
FSTAT by Jérome Goudet: www2.unil.ch/popgen/softwares/fstat.htm
GDA (Genetic Data Analyses) by Paul O. Lewis and Dmitri Zaykin: http://hydrodictyon.eeb.uconn.edu/people/plewis/software.php
Copy-Chapter 5: Basic sampling strategies: theory and practice
Jose Crossa
Biometrics and Statistics Unit International Maize and Wheat Improvement Center (CIMMYT) Apdo. Postal 6-641, 06600 Mexico, DF, Mexico
E-mail: j.crossa(at)cgiar.org
Roland Vencovsky
Dept. of Genetics ESALQ/Universidade de Sao Paulo Cx P. 83,13400-970, Piracicaba, Sao Paulo, Brazil
E-mail: rvencovs(at)esalq.usp.br
|
2011 version |
1995 version |
||
|
Open the full chapter in PDF format by clicking on the icon above. |
|||
This chapter is a synthesis of new knowledge, procedures, best practices and references for collecting plant diversity since the publication of the 1995 volume Collecting Plant Diversity: Technical Guidelines, edited by Luigi Guarino, V. Ramanatha Rao and Robert Reid, and published by CAB International on behalf of the International Plant Genetic Resources Institute (IPGRI) (now Bioversity International), the Food and Agriculture Organization of the United Nations (FAO), the World Conservation Union (IUCN) and the United Nations Environment Programme (UNEP). The original text for Chapter 5: A Basic Sampling Strategy: Theory and Practice, authored by A. H. D. Brown and D. R. Marshall, has been made available online courtesy of CABI. The 2011 update of the Technical Guidelines, edited by L. Guarino, V. Ramanatha Rao and E. Goldberg, has been made available courtesy of Bioversity International.
Please send any comments on this chapter using the Comments feature at the bottom of this page. If you wish to contribute new content or references on the subject please do so here.
Back to list of chapters on collecting
Internet resources for this chapter
Abstract
|
|
Programmes for conserving genetic resources have collected, received and stored hundreds of thousands of accessions of different cultivated species and their wild and weedy relatives. Collection and regeneration protocols must consider the species (i.e., allogamous, partially allogamous, autogamous and dioecious) to ensure that the sample is representative of the population. Previous studies have used allelic richness as the basic parameter for determining sample sizes for genetic resource conservation. The concept of variance effective population size is important to the measurement of genetic representativeness and has been successfully used in genetic conservation (regeneration and collection). The aim of this chapter is to show how to practically apply the theory developed earlier and to demonstrate its use for answering practical questions that a manager of genetic resource conservation might pose when collecting and regenerating plant genetic resources. This chapter explains strategies for determining efficient sample size in order to maintain the representativeness of the original diversity when collecting and regenerating genetic resources.
Introduction
The great genetic complexity of most plant populations and the many possible ways that genetic resources may be used in the future makes it difficult to provide simple and efficient sampling schemes and optimal sample sizes for the maintenance of all species (Namkoong 1986). Programmes for the conservation of genetic resources and genebanks around the world have collected (in their centres of origin or elsewhere), received and stored hundreds of thousands of accessions of different cultivated species and their wild and weedy relatives. These accessions represent a wide spectrum of population diversity. Collection and regeneration protocols must consider the species (including allogamous, partially allogamous, autogamous and dioecious species, plus the type of materials being collected and regenerated) to ensure that the sample is representative of the population.
Previous studies have developed equations for collection and regeneration to be applied when using practical breeding schemes or methods for conserving genetic resources, mainly of monoecious species. The studies and research previously done on conservation of genetic resources concentrated on developing sample sizes based on maximizing allelic richness or the number of distinct alleles at a single locus (Marshall and Brown 1975).
Another important measurement of representativeness is related to how stochastic changes in allelic frequency – caused by sampling error in small populations (random genetic drift) – lead to continuous fixation and loss of alleles, and reduce the proportion of heterozygous individuals in the population (Crow and Kimura 1970; Wright 1931). These random changes in allelic frequency affect the genetic representativeness of the finite population. In a large mating population of N individuals, the reduced number of progenitors whose offspring will constitute the next generation causes random genetic drift, which is quantified and predicted using the parameter called "effective population size" (Ne). The effective population size is the size of an ideal population that has the same amount of drift in allelic frequency or the same rate of decrease in heterozygosity as the actual population. Several factors affect the effective size of a population, including the number of parents per generation, the number of corresponding offspring, the number of male and female gametes contributed per individual in the parental population, the mating system of the species, and so on. The effective population size, taken as a measure of the genetic representativeness of a seed sample, can be adapted to specific aspects of plant breeding and conservation of genetic resources, such as seed regeneration and collection.
During the process of collecting, storing, regenerating and restocking germplasm, genetic drift occurs and affects a population’s genetic integrity in a number of ways. First, when collecting germplasm in the field, an appropriate sampling strategy should be used to avoid, as much as possible, dramatically reducing the size of the population (bottleneck). Second, when accessions are stored, the different survival rates of genotypes and the accumulation of mutations affect the genetic integrity of the accessions. Third, when seed of an accession is drawn for regeneration, the sample needs to be optimum in order to avoid genetic drift due to sampling or to differential survival (germination) or fecundity, leading to changes in the genetic constitution of the accession. Fourth, when plants of accessions are being regenerated in the field, insects, diseases, and other environmental factors can affect the plant stand, thereby limiting the accessions’ gametic contribution (offspring) to the next generation. Since we do not know which alleles will prove useful in the future, it is essential that sampling be done efficiently and that populations be of sufficient size to maintain as much genetic diversity as is practical. Large samples are expensive and difficult to manage, but if samples are too small, genetic diversity may be affected by the loss of valuable alleles through random changes in allelic frequency. Maintaining allelic diversity during regeneration depends on factors such as sampling procedures, seed viability and mating systems, all of which cause random genetic drift.
Concerning the sample size for collecting germplasm, Allard (1970) pointed out that most plant species contain remarkable stores of genetic variation and consist of millions of different genotypes. Plant collectors can hope to sample only a fraction of the variation that occurs in nature. It is important that this fraction be as large as possible and contain the maximum amount of useful (now and in the future) variation. Allard (1970) also recognized that collectors as well as end-users of germplasm have limited time and resources at their disposal. Thus, the problem is to define a sampling procedure that yields the maximum amount of useful genetic variation, within a specified and limited number of samples (Marshall and Brown 1975).
The aim of this chapter is to show how to apply the theory and equations developed earlier and to demonstrate their use for answering the practical questions that a manager of genetic resource conservation might pose when collecting and regenerating plant genetic resources. It includes theoretical considerations for probability models that compute the required sample size for conserving alleles at loci and for developing strategies for efficient sample size to maintain the representativeness of the original diversity when collecting and regenerating genetic resources. It also provides theoretical concepts on the variance effective population size (Ne(v)), and describes the derivation of manageable equations for collection and regeneration of germplasm. We give practical examples of how to (1) compute the required sample size for maintaining, with a certain probability, at least one copy of each allele at independent loci in the accession to be regenerated, (2) assess practical procedures for the collection and regeneration of genetic resources that will increase the Ne(v) of random-mating populations and the Ne(v) of species with mixed self- and random-mating systems of reproduction and different natural rates of self-fertilization, and (3) examine practical collection and regeneration procedures that will increase the Ne(v) of dioecious species with different proportions of male and female plants.
Theory
Probability models for number of alleles in the sample
We are interested in finding a sample size ng such that the probability of detecting at least one allele of each allele class is greater than a quantity 1- α or P(n)>1-α (for small α). Except in the case of synthetics derived from inbred lines, in real situations, allele frequencies are unknown; therefore, some simplification is necessary. Assuming that k-1 alleles occur at an identical low frequency of p0 and that the kth allele occurs at frequency of 1-[(k-1)p0], Crossa et al. (1993) showed that the sample size (ng gametes) required to retain with a probability P=1-α that at least one copy of each of the k allelic classes in each of the m loci should be larger than
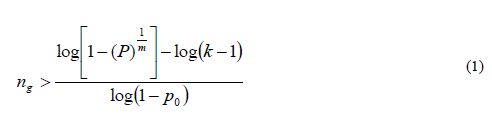
where it is assumed that loci are independent and that diploid individuals (not gametes) are sampled. The assumption of loci independence is unrealistic, since genetic drift may cause non-random associations between linked loci. If the population is under random mating (a cross-pollinated species), linkage equilibrium can be assumed for all possible pairs of loci, so it is expected that, for each pair of loci, a similar number of coupling and repulsion combinations occur. This obviously does not hold for selfpollinated species or species with mixed self- and random-mating systems of reproduction. Therefore equation 1 only offers approximate guidelines for the range of sample sizes, which are greatly dependent on the frequency of rare alleles. Furthermore, sampling ng= 2N gametes is equivalent to sampling (½)ng= N individuals (diploid zygotes) only for panmictic populations (i.e., idealized random-mating populations of
infinite size with no association between any two genes within individuals). In this case, the number of diploid individuals that need to be sampled is exactly half the number of gametes (ng).
It should be pointed out that the range of sample sizes given by equation 1 is based solely on probability models and does not consider the genetic structure of the population or specify how well a particular sample represents the reference population in terms of genetic parameters such as variance of allelic frequency, inbreeding, random genetic drift due to sampling error, genetic linkage, etc. Furthermore, probability models do not, by themselves, specify appropriate mating and reproduction systems such as panmixia, mixed self- and random mating, self-fertilization, and so forth, which could, under specific circumstances, maximize the genetic representativeness of the sample.
Therefore, it is clear that for an initial census of a population of size N, it is very likely that Ne < N. For studying factors that will make Ne > N, aspects of population genetics theory must be incorporated into the probability models in order to facilitate the estimation of parameters such as the mean and variance of male and female contributed gametes and the mating systems that would facilitate control of male and female gamete contributions and thus allowing to increase Ne .
Measure of representativeness: variance effective population size [Ne(v)]
The concept of effective population size Ne(v) is useful when studying the breeding structure and genetic representativeness of an actual population, as related to an ideal population in which individuals mate at random with no variation in fertility: the number of progeny per parent has a binomial distribution (which approaches Poisson for large sample sizes) and its size is kept constant through time (Wright 1931). The effective population size determines the amount of sampling error between generations that causes random fluctuations in allelic frequency. On the other hand, natural and breeding populations fluctuate in size from one generation to another, and some individuals might not produce gametes or might have different natural inbreeding levels and different natural self-fertilization rates than others. Thus, measures of effective size often deviate from the size of the actual population.
Crow and Kimura (1970) derived models for studying the genetics of finite populations and assessed the relationship between the actual size of a population, N, and the distribution of progeny among parents by estimating its mean and variance. They derived an expression for the variance effective population size (Ne(v)) when a random sample of individuals is taken from an original population of size N, assuming that all the individuals potentially contribute male and female gametes,
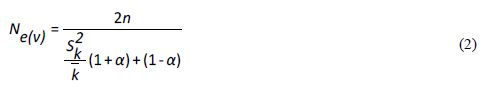
where α measures the departure from Hardy Weinberg equilibrium in generation t -1,
![]()
; n is the number of offspring in generation t (or total number of seeds collected from the parents); and k is the number of gametes contributed by a particular parent. This can be considered a binomial random variable in the case of a random sampling of gametes with no variation in fertility, where
![]()
are the mean and variance of the gametes contributed by the parents, respectively.
For large N,
![]()
Crow and Denniston (1988) provided expressions of the inbreeding and the variance effective number that are general for populations under random mating, and presented formulas as functions of means, variances and covariances of the number of gametes contributed by parents to the offspring.
Genetic models based on the number of male and female gametes contributed by individuals of monoecious plant species have been developed for variance effective population size applied in the context of artificial selection (Vencovsky 1978) and to specific aspects of genetic resource conservation (i.e., collection and regeneration) (Crossa and Vencovsky 1994; Vencovsky 1978). Later, Crossa and Vencovsky (1997, 1999) and Vencovsky and Crossa (1999a, 1999b, 2003) showed the theoretical developments and practical applications of variance effective population size when drift occurs at two stages: when sampling parents for reproduction and when sampling gametes (offspring) from those parents for monoecious populations and for populations under mixed self- and random mating.
Two-stage sampling model for random-mating species
Crow and Kimura (1970) assumed that all N individuals in the parental generation potentially contribute gametes to the next generation. However, in real-life situations of plant breeding, regeneration and collection of plant genetic resources, some plants may fail to produce gametes (offspring) due to external factors such as poor seed viability or germination, insects and diseases in crossing blocks or the systematic exclusion of a fraction of parents, etc. Therefore, a more realistic model would consider that the overall effect of sampling on allelic frequency drift is the summation of drift occurring at two stages: (1) when sampling parents from the original population (first stage) and (2) when sampling gametes from these parents (second stage).
Vencovsky (1978) first proposed models for computing V(k) and Ne(v) for the two-stage sampling model for monoecious species that considers that some plants might not contribute gametes to the next generation. Crossa and Vencovsky (1994) provided approximate equations for computing V(k) and Ne(v) for germplasm collection and regeneration with and without control of contributed male and female gametes. Crossa and Vencovsky (1997) provided the theoretical development of the two-stage model, gave an alternative derivation based solely on the theory of random sampling within a finite population, and demonstrated practical procedures for seed collection and regeneration.
Consider an initial set of N diploid monoecious plants (reference population), where P plants contributing male and female gametes are randomly selected (0 < P ≤ N). From the remaining N-P plants, R contributing only male gametes are also sampled at random [0≤ R ≤ (N-P)]. Therefore, M =P+R plants contribute male gametes, P plants contribute female gametes, and N-M plants do not contribute any gametes at all. Thus, the proportion of functional seed parents is u=P/N (or P =uN) (where 0< u ≤ 1) and the proportion of functional pollen parents is v= (P+R)/N =M/N (or M =vN) (0 < v ≤ 1). With these proportions, it is possible to simulate several important practical situations that arise when regenerating and collecting genetic resources.
For example, the condition given by Crow and Kimura (1970) when developing equation 2 (i.e., that all N individuals potentially produce male and female gametes) is achieved by considering P=M=N or u=v=1, that is, a perfect stand of plants in the field. For seed regeneration, this means that all plants in the field are used as male and female parents. On the other hand, if P<N, M<N such that u<1, v<1, some plants fail to produce gametes due to poor germination, poor seed viability or a poor stand of plants in the field because of insects, diseases or other environmental factors.
In seed collection activities, parameters u and v are fractions of seed and pollen parents, respectively, that effectively contribute gametes for generating the sample of seeds collected. They should be measured in relation to the size of the reference population under natural conditions. For monoecious species, Crossa and Vencovsky (1994) derived the following Ne(v) expressions for different alternative sampling schemes of female and male gametes. As shown in Annex A, we considered three different cases, depending on how male and female gametic control is performed.
-
Case 1: Plant-to-plant hand pollination is practiced and equal numbers of seeds are taken from each plant (female plus male gametic control; FGC + MGC scheme) (equation 3).
-
Case 2: Pollination is random and the same number of seeds is taken from each seed parent (female gametic control: FGC scheme) (equation 4).
-
Case 3: Pollination is random and n seeds are randomly sampled from a bulk of seeds stemming from P seed parents (RS schemes) and M pollen parents (equation 5).
For seed collection, it can be assumed for random-mating species that the number of pollen parents (M) is very large; then potentially M=N and v=1. This over-simplification is used for calculating an upper limit for Ne(v). Also, the number of seed parents can be considered to be much smaller than N (P<<N) and u=0. Thus, assuming that M is very large, M=N, and v=1, the approximation to Ne(v) is given by equations 6 and 7. Also, annex A shows how equation 6 can be written when the average number of seeds per seed parent is given by n/P
Two-stage sampling model for mixed self- and random-mating species
Many self-compatible species have a high natural rate of self-fertilization (s) and thus may be considered as having a mixed self- and random-mating reproduction system. Logically, the genetic structure of a mixed self- and random-mating species is complex because not all plants have the same level of natural inbreeding. Furthermore, the progeny of a population of a mixed self- and random-mating species will have a mixture of selfed seed with proportion s and half-sibs or outcrossed seeds with proportion 1- s. This model excludes biparental crosses between parents. Proportion s can be artificially manipulated by hand-pollination so that it becomes s = 1 when selfing all plants or s = 0 when crossing all plants. However, s varies from 0 to 1 in natural populations, which are assumed to be in inbreeding equilibrium when they reproduce naturally. In this case, f = s/(2-s) [or s = 2f/(1+f)]. Vencovsky and Crossa (1999a) extended the two-stage sampling models for random-mating species to include mixed self- and random-mating species (0 ≤ s ≤ 1). They also developed estimates and direct expressions for computing V(k) and Ne(v) with applications to specific aspects of germplasm regeneration and collection. The authors considered an initial set of N diploid plants where P plants (contributing male and female gametes) are randomly sampled from N and, subsequently, R plants (contributing only male gametes) are randomly sampled from N-P. Proportions u and v are defined as in two-stage sampling for random-mating monoecious species.
The model allows a correlation between the numbers of female and male gametes contributed per individual within the set of P plants (a correlation assumed to be zero for random-mating species). Therefore, the natural or artificial rate of self-fertilization (assumed to be constant over parents) is s, the proportion of crossing plants is 1-s, and n is the total number of seeds collected from the set of P parents. Then, 2ns is the expected total number of female and male gametes contributed from selfing and 2n(1-s) is the expected total number of male and female gametes contributed from crossing: the overall total of contributed gametes is 2ns+2n(1-s) = 2n.
Vencovsky and Crossa (1999a) considered random sampling of seed (RS) and female gametic control (FGC) under unrestrictive inbreeding and under inbreeding equilibrium. Here, we will consider only RS and FGC under inbreeding equilibrium. The general equations for a fraction u of potential parents contributing female gametes and v, the fraction of potential parents contributing male gametes, are given in Annex B. Equations 8 and 9 can be adapted for seed collection with the assumptions that the number of seed parents (P) is a very small fraction of the entire population (u = 0) and that the number of pollinating parents (for s < 1) is sufficiently large, allowing the assumption that M = N, such that v = 1. This last assumption tends to inflate the corresponding Ne(v) value. In practical situations, the number of pollen parents for each seed parent can be estimated using molecular markers, but it requires a sample of adult plants and the corresponding maternal offspring to be genotyped.
Based on these assumptions, equations 10 and 11 were obtained for collecting n seeds from P seed parents (Vencovsky and Crossa 1999a) of a population in inbreeding equilibrium with a natural rate of self-fertilization s. A fundamental Ne(v) expression is given by Cockerham (1969) for a group of n individuals or seeds differentiated from a reference population of infinite size solely by drift. See equation 12, which can be adapted for measuring the degree of representativeness contained in a single maternal descendant (equation 13), which is equivalent to equation 10 or 11 when P = 1.
Seed collection from several subpopulations
Under natural conditions, there may be situations in which a large population of a species, or meta-population, is made up of a group of subpopulations. When seeds are collected in such a situation, the number of subpopulations from which seeds should be sampled is an additional sampling unit to be considered and incorporated for estimating Ne(v). Annex C shows some of the equations obtained by Vencovsky and Crossa (2003) when extending the theory developed by Cockerham (1969).
Vencovsky and Crossa (2003) derived Ne(v) equation 14 (Annex C), where S* is the total number of subpopulations in the region and C2 is the squared coefficient of variation of the number of seeds collected from the S subpopulations, which is ni for subpopulations i, such that n= Σ ni (i = 1, 2, …, S). With equal ni, C2 = 0. Parameters FST and FIT are Wright’s measures of the divergence among subpopulations and the total inbreeding coefficient, respectively (Weir, 1996). These F statistics can be estimated for the parental generation using codominant genetic markers.
When seeds are not collected in bulk but on a progeny basis, an additional sampling unit is incorporated, namely the number of seed parents. Now the expression for estimating Ne(v) is equation 15 (Vencovsky et al. 2007), where C2s is the square of the coefficient of variation of the number of seeds among subpopulations and C2m is the square of the coefficient of variation of the number of seeds among seed parents. Also, ![]() is the average coancestry among offspring within progenies, which can also be estimated using codominant molecular markers. Equations 14 and 15 (annex C) are useful for planning the collection sampling strategies necessary to obtain a desired Ne(v) value.
is the average coancestry among offspring within progenies, which can also be estimated using codominant molecular markers. Equations 14 and 15 (annex C) are useful for planning the collection sampling strategies necessary to obtain a desired Ne(v) value.
Two-stage sampling model for dioecious species
Originally Crow and Kimura (1970) derived Ne(v) expressions for species with separate sexes based on simplified assumptions. Later Crow and Denniston (1988) made the necessary correction of this earlier work. The aim of Vencovsky et al. (2011) was to consider the statistical properties of the number of contributed gametes in various practical situations. To this end, they transformed and adapted the formulas of Crow and Denniston (1988) in such a way that they are easy to apply in practical breeding situations and when collecting and regenerating genetic resources. Vencovsky et al. (2011) consider a finite reference population such that all individuals are potentially functional parents; they also assume that, of the reference population, only a fraction of individuals is taken as functional parents. The derivations and results given by Vencovsky et al. (2011) refer only to dioecious species, and only the variance effective population size is considered. The reference population is considered under random mating, a condition also assumed by Crow and Denniston (1988).
Some of the derivations of Vencovsky et al. (2011) are shown in Annex D and refer to populations of arbitrary size, excluding some parents, that is, a fraction of parents is systematically discarded or rejected, such that only a subset of the initial Nf female and Nm male parents effectively participate in the reproduction process (Annex D, equations 16–18). Consider that, of the initial Nf female parents, only P participate in reproduction such that the fraction is
![]()
For male parents (M), the fraction is
![]() .
.
For the rejected Nf - P females and Nm - M males, the number of gametes contributed will be zero. Consider that f (female) and m (male) offspring are sampled, with a total of t = f + m, and also that the sex ratio is r =f / (f + m).
In another case, all the parents are included (Annex C, equations 19–21). In both cases, when some parents are excluded or all the parents are included, three cases of gametic control are considered, no gametic control or random sampling (RS), female gametic control (FGC), and female gametic control and male gametic control (FMC+MGC)
Practical applications
Probability models for number of alleles in the sample
The statistical genetic models used by Crossa et al. (1993) and based on equation 1 indicate that sample sizes of 160 to 250 plants of a random-mating population are required for capturing alleles at frequencies of 0.05 or higher in each of 150 loci, with 90%–95% probability. These formulas consider the sample size for conserving at least one allele per locus, but they do not quantify the probability of conserving two, three or more alleles per locus. The genetic diversity of a population depends on the number and frequency of alleles at a locus and across loci, and determining a sample size depends on whether estimates of allele frequencies are available (Hernandez and Crossa 1993).
However, when the required probability for conserving alleles at different loci increases or the frequency of a rare allele (p0) drops to 1%, larger sample sizes than those specified earlier are required. For example, for unknown associations between genes within individuals and p 0 =0.001, sample sizes of between 533 and 1708 individuals will retain, with a probability of 0.9999, at least one allele from each class, considering a wide range of alleles, k = 2 to 20, and a number of loci ranging from m = 5 to 1000. Sample size is always more affected by low allele frequency than by the number of alleles or the number of loci. To maintain alleles at 3% frequency with a 0.9999 probability, assuming unknown associations between genes within individuals, the required sample sizes are between 177 and 564 individuals for 2 to 20 alleles per locus and for 5 to 1000 loci. For retaining alleles at a frequency of 5%, 105 to 335 individuals are required. For 6 alleles per locus with allele frequencies between 0.03 and 0.10 and for 1 to 20,000 loci, a sample size of between 84 and 750 individuals will preserve at least one copy of each allele class in each locus with a probability of 0.9999999.
Assuming two alleles at each of the 20,000 loci and one of them at a 0.05 frequency, 186 individuals will preserve this allele at each locus with a 95% probability. However, a sample size of 172 individuals will only retain an allele at 5% frequency, assuming no association between genes within individuals at any locus. However, this does not seem to be sufficient if associations between genes within individuals exist at some loci and/or if maintaining alleles at frequencies between 3% and 1% is required.
Assuming that k-1 alleles occur at an identical low frequency for all loci makes the required sample size estimated by equation 1 conservative, because it is likely that some alleles will have higher frequencies, at least at some loci. The assumption of loci independence is unrealistic, since genetic drift may cause non-random associations between linked loci. If the population is under random mating (a cross-pollinated species), linkage equilibrium can be assumed for all possible pairs of loci, so that a similar number of coupling and repulsion combinations can be expected to occur for each pair of loci. This obviously does not hold for self-pollinated species or species with mixed self- and random-mating systems of reproduction.
Recommendations for estimating general sample size using probability models
General recommendations and/or guidelines concerning sample sizes should be given
-
within ranges (or intervals), depending on model assumptions and biological considerations such as number of alleles, loci, genetic linkage, etc.
Furthermore, it is important to point out that
-
certain sample sizes (n) obtained from the probability models might or not provide a similar value for Ne(v).
Two-stage sampling model for random-mating species – regeneration
For germplasm regeneration of N (finite) plants in the field, equations 3, 4 and 5 (annex A) can be adapted for different situations and mating designs, for monoecious species. Assuming that accession size is kept constant (n = N), these expression are much simplified, as illustrated in the following cases.
Two general cases are considered.
Case 1
The integrity of the accession is affected (u = P/N≤1), and there is loss of seeds from the original accession, but pollen and seeds are contributed by all remaining plants. Then P = M = uN (P = M; u = v). This is similar to the case where seeds of an accession are lost due to environmental causes, during storage in the genebank, or while accession plants are growing in the field. The exception is when u = 1, as shown in Table 5.1.
Table 5.1: Variance Effective Population Size (Ne(v)) for Regenerating Accessions of a Monoecious Species Using Expressions Given for Cases 1a-c and Cases 2b-c for n=N=1000 and Different Proportions of Parents Contributing Male and Female Gametes to the Next Generation (u), Assuming Constant Accession Size
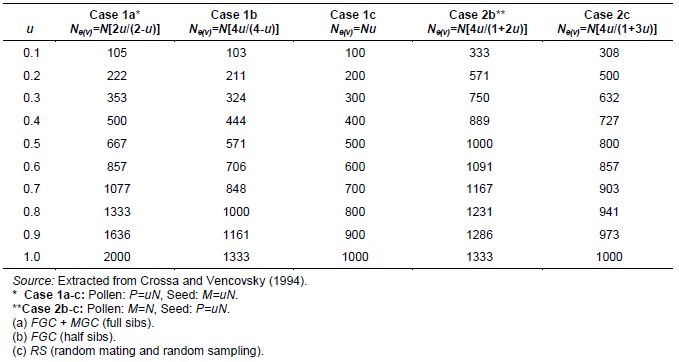
Case 2
The integrity of the accession is not affected; that is, pollen is produced by all plants (M = N) but seed is collected from only P plants. Then, M = N, v = 1, but P = uN. This case simulates a situation where only a portion of the total number of pollinated plants in the field is harvested.
For Case 1, three mating designs based on different types of gametic control are considered:
1. female and male gametic control (full-sib mating system), FGC + MGC
2. female gametic control only (half-sib mating system), FGC
3. no female and male gametic control, that is, random open pollination, and unequal numbers of seeds are randomly taken from the set of P parents, RS
For Case 2, only schemes FGC and RS (b and c) are considered here because a scheme with control of both types of gametes (FGC+MGC) is not possible because, with Nu female parents available, only Nu pollen parents will be taken for obtaining full-sib progenies and not N.
In Case 1a (seed and pollen from P = M = uN), where female and male gametic control involves full-sib crosses and taking equal numbers of seeds from P = M = uN plants, Ne(v) = N[2u/(2-u)]. In Case 1b (seed and pollen from P = M = uN), where random pollination involves half-sib crosses among P = M = uN plants, and female gametic control implies taking equal numbers of seeds from P = uN plants, Ne(v)= N[4u/(4-u)]. In Case 1c (seed and pollen from P = M = uN), with random pollination and unequal numbers of seeds randomly taken from P parents, Ne(v) = Nu.
In Case 2b (seed from P = uN and pollen from P = M), where random pollination includes half-sibs among all plants, but female gametic control implies taking seeds from only P = uN pollinated plants, Ne(v)= N[4u/(1+2u)]. In Case 2c, with random pollination and unequal numbers of seeds randomly taken from P = uN parents, Ne(v) = N[4u/(1+3u)].
The above expressions for Cases 1 and 2 and the three mating systems, considering a range of accession losses (from 90% [u=0.l] to 0% [u=1, full stand of plants in the field]), are given in Table 5.1. For Case 1, with a perfect stand of plants (u=1), taking equal numbers of seeds per pollinated plant (female gametic control) and using hand-pollination (full-sibs) (male gametic control) produces Ne(v) = 2N; with only female gametic control and random pollination (half-sibs), Ne(v) = (4/3)N; and without male and female gametic control, Ne(v) = N. Values of Ne(v) for Case 2 (last two columns in Table 5.1) tend to be larger than their corresponding columns for Case 1 (the first three columns in Table 5.1) because the pollen pool is larger when M=N than when M=uN (except when u=1).
How can a genebank curator regenerate an accession of a monoecious plant species that has lost a percentage of its seeds or plants, and still attain Ne(v) = N?
In Case 1, a loss of 30% (u = 0.7) of the plant accessions can be recovered by male and female gametic control (Ne(v)=1077 when n = 1000), whereas a loss of 20% (u = 0.8) can be recovered by simply taking equal numbers of seeds from the 800 randomly pollinated plants that remained in the field (Ne(v) =1000).
Furthermore, in Case 2, if all 1000 plants are left to pollinate randomly (half-sibs), but equal numbers of seeds are taken from only 500 of them (u = 0.5), Ne(v)=1000 = n. This indicates the importance of controlling female gametes as a mechanism for recovering the desired magnitude of Ne(v) because of the possible loss of seeds and/or plant accessions before and during the growing cycle (Case 1) or the potential problems encountered when harvesting only a portion of the total number of pollinated plants in the field (Case 2).
Table 5.1 shows that Ne(v) is larger for female gametic control with half-sibs (Case 2 [fifth column in Table 5.1]) than for female and male gametic control with full-sibs (Case 1 [second column in Table 5.1]). This is true up to an accession loss equal to or greater than 30% (u ≤ 0.7) (1167 versus 1077 for u = 0.7). When u > 0.7 under female and male gametic control with full-sib families from P = M = u N plants, Case 1 is superior to that of half-sib families from M = N plants, but female gametic control on only P = uN families (1333, 1636 and 2000 versus 1231, 1286 and 1333 for u = 0.8 , 0.9 and 1.0, respectively). The half-sib mating system of Case 2 is the best option for compensating for insufficient sampling of female parents (smaller values of u) through increasing Ne(v), in contrast to the full-sib alternative of Case 1, which becomes important only for smaller accession losses (u > 0.8). On the other hand, female and male gametic control with the full-sib system in Case 1 (second column in Table 5.1) is always superior to female gametic control with the half-sib system in Case 1 (third column in Table 5.1) for all values of accession loss, as well as for the situation of no gametic control (fourth column in Table 5.1).
As already pointed out, when comparing half-sibs with female gametic control (Case 2) versus full-sibs and total gametic control (Case 1), the former is preferred if deterioration of the accession is intermediate to severe (0 < u < 0.7). Accession losses in Case 1 increase drift that is attributable to sampling parents (first stage of sampling), but controlling female and male gametes should decrease drift due to sampling of gametes (second sampling stage) and, therefore, should help to control overall drift. The advantage of the half-sib system is that it does not require hand-pollination because pollen from all plants in the field can be used. It is a valuable alternative for decreasing the contribution to drift attributable to the sampling of parents (first stage).
Recommendations for regenerating random-mating monoecious species
Generally speaking, in the regeneration process discussed so far, two aspects are fundamental for maintaining adequate representativeness of accessions:
-
avoiding excessive deterioration of the accession
-
practicing female gametic control when sampling seeds after reproduction
Two-stage sampling model for random-mating species – collection
In collection activities, obtaining exact estimates of Ne(v) when collecting seeds is not possible in most cases. This is due to the fact that the real size of the reference population is not known, and fractions u and v, therefore, cannot be estimated. Equations 6 and 7 (Annex A) are only approximations, since the number of female parents sampled for seed collection (P) is considered to be a very small fraction of the entire population (u=P/N = 0) and the number of pollen parents is admittedly very large, such that v=M/N=1.
Effective numbers, consequently, are overestimated. In any case, equations 6 and 7 can be considered for showing that under these assumptions, Ne(v) is dominated by the number of seed parents (P). As an example, consider a sample of 1000 seeds taken from P = 100 (10 seeds per parent), P = 200 (5 seeds per parent) and P = 500 (2 seeds per parent). With female gametic control, the resulting Ne(v) values are 308, 500 and 800, respectively (equation 6). If seeds are bulked and then sampled, the resulting Ne(v) values for n = 1000 are 286, 447 and 667, respectively (equation 7). Once again, results demonstrate the importance of female gametic control in these activities.
The alternative form of equation 6 can be used for planning collection strategies. If, for instance, collecting 15 seeds per parent (![]() =15) is feasible, and a value of Ne(v)=1000 is required for representing the reference population, then Ne(v) = 4P (
=15) is feasible, and a value of Ne(v)=1000 is required for representing the reference population, then Ne(v) = 4P ( ![]() /
/![]() +3) = 4P (15/18) = 1000, and P = 300 is the number of seed parents necessary to achieve Ne(v)=1000.
+3) = 4P (15/18) = 1000, and P = 300 is the number of seed parents necessary to achieve Ne(v)=1000.
The total number of seeds required in this case is n = 4500, and the average Ne(v) per maternal progeny is ![]() e(v) = 3.33. An additional condition not mentioned earlier and required for the validity of computing P is that the seed parents should be genetically unrelated (negligible coancestry among all parents).
e(v) = 3.33. An additional condition not mentioned earlier and required for the validity of computing P is that the seed parents should be genetically unrelated (negligible coancestry among all parents).
There should be a minimum distance among seed parents during seed collection in order to have negligible coancestry among adult individuals. Investigations on pollen distance and on the reproductive neighbourhood area are generally recommended for estimating this distance (Viegas et al. 2011). Molecular markers can be used for this propose.
Recommendations for collecting random-mating monoecious species
The main lessons for collectors of genetic resources are that Ne(v) can be increased by
-
increasing the number of seed parents (P)
-
taking an equal number of seeds per seed parent, that is, exercising female gametic control
Two-stage sampling model for mixed self- and random-mating species – regeneration
Equations 8 and 9 (Annex B) show that Ne(v) increases linearly with sample size n, for a given s, when regeneration occurs before any loss of plants in the field, with all parents contributing male and female gametes. Both equations assume inbreeding equilibrium and can be adapted to germplasm regeneration and collection, considering the effect of (1) an arbitrary rate of natural self-fertilization (s) and (2) random sampling of seeds or female gametic control (FGC). We will examine the same two cases we studied when considering the two-stage model for random-mating species, that is,
-
Case 1: loss of accessions given by u < 1 and v = u, with seed parents P = uN, and pollen parents M = uN
-
Case 2: no loss of accessions but seeds taken from uN pollinated plants; that is, seed parents P = uN and pollen parents M = N, when s < 1. An additional effect that can be considered is given by the fact that the number of collected seeds (n) that can be taken is equal to N (constant n=N) or arbitrary (n ≠N).
Results obtained by Vencovsky and Crossa (1999a) indicated that FGC gives higher values of Ne(v) than RS. Female gametic control combined with adequate levels of u (u > 0.7) becomes an effective combination for maintaining values of Ne(v) equal to or higher than n, when n=N; whereas, with RS, values of Ne(v) are always smaller than sample size (n). In Cases 1 and 2 (here and below), RS of cross-fertilizing species (s = 0.0) is less affected by accession deterioration than are more self-fertilizing species at any level of accession deterioration (u). However, in Case 1 and Case 2, FGC of cross-pollinating species gives slightly higher values of Ne(v) than that of more self-fertilizing species but only for severe values of accession deterioration; the reverse is true for mild accession loss. Vencovsky and Crossa (1999a) found that Ne(v) = n for high values of u and when the species approaches panmixia (s = 0.0), under RS.
Other findings from Vencovsky and Crossa (1999a) relative to germplasm regeneration can be pointed out, as given below.
Female gametic control (FGC) always gives higher Ne(v) values than random sampling (RS) in all circumstances. This practice produces a rapid increase in Ne(v) for autogamic species when u > 0.7.
In Cases 1 and 2, when seeds are taken randomly (RS), accession regeneration is more efficient for panmictic species than for autogamic ones, under any level of accession deterioration. This is also true with FGC and severe deterioration loss. On the other hand, autogamic species with FGC produce higher Ne(v) in regeneration than allogamic species when u is mild.
For germplasm collection, the results obtained by Vencovsky and Crossa (1999a) contradict those for regeneration; that is, attaining adequate Ne(v), even with FGC for collecting autogamic species, is more difficult than regenerating accessions of this category when u > 0.8. The reverse is true for panmictic species.
For constant accession size (n=N) and FGC, considered here as a reference point, the minimum value of u (u*) acceptable for having Ne(v)=n is given by u*=4/(s2+5). Evaluating this quantity gives u*= 0.8, 0.76 and 0.67 for s = 0.0, 0.5 and 1.0, respectively. This indicates that more autogamic species permit slightly higher levels of accession deterioration, compared to more panmictic ones. Values given in Table 5.2 confirm this.
Increasing sample size (n) during regeneration increases Ne(v), but only when s < 1. For perfectly autogamic species (s = 1), increasing n has no effect on Ne(v), as can be seen in Table 5.2.
Table 5.2: Variance Effective Population Size (Ne(v)) When Regenerating N= 500 Plants and Harvesting an Arbitrary Number of Seeds (n) for Different Values of Accession Loss or Proportion of Functional Parents (u) and Natural Rate of Self-Fertilization (s), Assuming Inbreeding Equilibrium
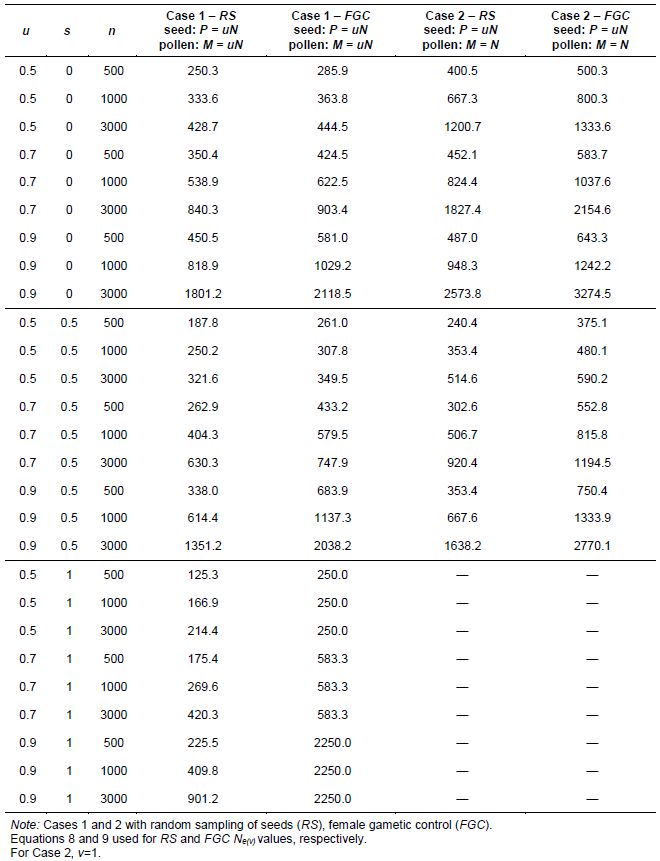
How can a genebank curator regenerate an accession of a mixed self- and random-mating species that has lost a percentage of seeds or plants and still attain Ne(v)=n?
We can study the advantages of FGC over RS systems under Cases 1 and 2. For this situation, we consider an arbitrary value of n (n≠N). Values of Ne(v) for regenerating a hypothetical accession of N=500 plants in the field for Cases 1 and 2, under RS and FGC for various values of accession loss (1-u), natural rate of self-fertilization (s) and sample size (n) are shown in Table 5.2, assuming that plants are in equilibrium with respect to the mating system.
In Table 5.2, effective sizes for Case 2 are always higher than the corresponding ones for Case 1, because of the larger pollen pool in Case 2, where M=N as compared to M=uN in Case 1. With complete autogamy (s = 1), the condition M=N is impossible because there is complete self-fertilization. This situation (M=N with s = 1) was wrongly included by Vencovsky and Crossa (1999a). The advantage of Case 2 over Case 1 can be visualized by comparing Ne(v) values within the RS and FGC systems.
As already mentioned, considering only Case 1, Table 5.2 shows that for small losses in accessions (large u) it is easier to regenerate more autogamic species, whereas for large accession losses (small u) it is easier to regenerate more panmictic species.
If we collect n=N=500 seeds from 250 plants (u = 0.5) by taking two seeds per plant (FGC) of a panmictic species (s = 0) but using pollen from all M=N=500 plants (Case 2), the required condition Ne(v)=N=500 is achieved (Ne(v)=500.3 in the last column of Table 5.2). On the other hand, if we collect n=500 seeds from 250 plants, by taking two seeds per plant (FGC) of an autogamous species (s = 1) (Case 1), the required condition is never achieved because Ne(v)=(1/2)N=250, irrespective of sample size n. As expected, this indicates that severe accession loss has a greater impact on autogamic species than on panmictic ones. If pollen from all 500
plants of a panmictic species (s = 0) is used and 12 seeds (FGC) are taken from only 250 plants (u = 0.5 and n = 3000) (Case 2), Ne(v) = 1333.6 = 2.67N and Ne(v) = 1200.7= 2.40N with RS (Table 5.2). In Case 1, where the pollen pool is smaller than in Case 2 (for s < 1), with FGC, the condition that Ne(v) ≥ N is only achieved for a smaller accession loss (u > 0.7) than that allowed for Case 2 and u = 0.5.
In Case 1, when there is an accession loss of 10% (u = 0.9) and 3000 seeds are collected under FGC from a panmictic species (s = 0), Ne(v)= 2,118.5 > 4N. In Case 2, a 30% accession reduction on the female side (u = 0.7) and collecting n = 3000 will produce Ne(v) = 2154.6 = 4.31N.
For the three types of species considered, the condition that Ne(v) ≥ N is reached for u ≥ 0.7, under Case 1.
In Table 5.2, it can be seen that the highest Ne(v) values are obtained by practicing FGC and that fractions of accession loss are very small (u = 0.9). In general terms, the combination of female gametic control with the possibility of having a larger pollen pool, as in Case 2, produces important increases in Ne(v) for u = 0.7, 0.8 and 0.9, especially for sample size n >N. It is worth mentioning that the ideal situation for regenerating an accession occurs with FGC in autogamic species (s = 1) and no accession loss (u = 1). In such a case, there is no drift between the original and the regenerated accession and Ne(v) = ∞ (equation 9). Practicing random sampling in such a situation is inadequate.
Recommendations for regenerating mixed self- and random-mating species
-
Taking an equal number of seeds (FGC) gives higher values of Ne(v) than a random number of seeds (RS).
-
Female gametic control combined with adequate percentage germination (u >0.7) becomes an effective combination for maintaining values of Ne(v) equal to or higher than n, when n=N; whereas, with RS, values of Ne(v) are always smaller than sample size n.
-
Random sampling of cross-fertilizing species (s = 0.0) is less affected by accession deterioration than it is with more self-fertilizing species at any level of accession decrease in percent germination.
-
The combination of female gametic control with the possibility of having a larger pollen pool produces important increases in Ne(v). The ideal situation for regenerating an accession occurs with FGC in autogamic species (s = 1) and no accession loss (u = 1). In such a case, there is no drift between the original and the regenerated accession and Ne(v)= ∞ . Practicing random sampling in such a situation is inadequate.
Two-stage sampling model for mixed self- and random-mating species – collection
For collection activities, equations 10 and 11 (Annex B) are used to perform some numerical evaluations. It is assumed that n = 1000 seeds are collected from P=100 and P=20 adults, assuming random sampling (RS) and female gametic control (FGC), for different values of the natural rate (s) of self-fertilization. In natural conditions, the population is assumed to be in equilibrium relative to the mating system. Corresponding Ne(v) values are given in Table 5.3.
Table 5.3: Effective Sizes Ne(v) of n=1000 Seeds Collected from P=100 and P=20 Seed Parents, for Random Sampling (RS) and Female Gametic Control (FGC), from a Population in Inbreeding Equilibrium and Rate of Self-Fertilization (s)
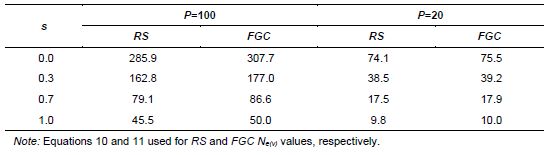
As can be seen in Table 5.3, the dominating factors in the effective size values, for n =1000 seeds collected, are the number of seed parents and the population’s rate of self-fertilization. Practicing gametic control has a positive effect for increasing Ne(v); however, that diminishes as the number of seed parents decreases.
Values such as those given in Table 5.3 can be used as a guide for planning sampling procedures when a specific Ne(v) value is desired. With FGC, P=100 (10 seeds per parent) and under panmixia (s = 0), we have an average effective size value of Ne(v)=3.1 per seed parent. To attain a value of Ne(v)=1000, in this case, P = 322 seed parents would be necessary under the supposition that they are genetically unrelated (negligible or zero coancestry among them). For autogamy (s =1.00) and P =100, we have an average
![]() e(v) = 0.5 per seed parent, meaning that P =2000 would be required to reach a total Ne(v) of 1000. This specific example reinforces the fact that obtaining seed samples with adequate representativeness is more difficult in more autogamic species.
e(v) = 0.5 per seed parent, meaning that P =2000 would be required to reach a total Ne(v) of 1000. This specific example reinforces the fact that obtaining seed samples with adequate representativeness is more difficult in more autogamic species.
Effective size values for a single maternal progeny, under the assumption of mixed self- and random mating, can be obtained directly from equation 13 (Annex B). Table 5.4 gives an Ne(v) that is applicable to this case for several sample sizes (n) and self-fertilization rates (s). Considering the same example as in the preceding paragraph, with n =10 seeds per seed parent and s = 0.00, Ne(v) = 3.1, as found earlier. The following numbers of seed parents (P) would be necessary for having a joint value of Ne(v)= 1000, for s = 0.0, 0.25, 0.5, 0.75 and 1.0, respectively, with n =10 seeds collected per seed parent: P =322, 526, 833, 1250 and 2000. For s =1.00, Ne(v)= 0.5 per progeny, which corresponds to a single gamete sampled from an idealized population.
In a broad review involving 30 tree species conducted by Sebbenn (2006), the number of seed parents (P) was computed for attaining an effective size of Ne(v)= 150. Values were obtained based on estimates of the average coancestry (![]() ) and the inbreeding coefficient (F), using molecular markers. The number of seeds collected per tree was considered large, such that (n-1)/n » 1 and (1+
) and the inbreeding coefficient (F), using molecular markers. The number of seeds collected per tree was considered large, such that (n-1)/n » 1 and (1+![]() F )/2n is negligible. Values of the number of seed parents (P) varied considerably among species, between 44 and 144, with an average of
F )/2n is negligible. Values of the number of seed parents (P) varied considerably among species, between 44 and 144, with an average of ![]() = 67. Most species showed a predominantly allogamic mating system with s varying between 0.0 and 0.25 and an average value of
= 67. Most species showed a predominantly allogamic mating system with s varying between 0.0 and 0.25 and an average value of ![]() = 0.08.
= 0.08.
Table 5.4: Variance Effective Population Size (Ne(v)) Values of a Single Maternal Progeny for Several Sample Sizes (n) and Natural Rates of Self-Fertilization (s), Reference Population of Infinite Size in Equilibrium under Mixed Self- and Random Mating
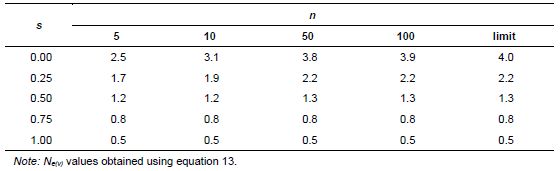
Recommendations for collecting mixed self- and random-mating species
The dominating factors in the effective size values are
-
the number of seed parents
-
the population’s rate of self-fertilization (s)
While practicing gametic control has a positive effect for increasing Ne(v), that diminishes as the number of seed parents decreases.
Two-stage sampling model for dioecious species
Several dioecious plant species are economically important, such as some domesticated dioecious arboreal species (Bandel and Gurgel 1967). Accounting for approximately 6% of angiosperms, dioecious species evolved from hermaphrodites in multiple independent events (Barret et al. 2010). Bawa (1980) mentions that dioecy is not as rare as is generally assumed. Bawa et al. (1985) found that there is a high level of dioecy (> 20%) among 333 tropical tree species. A similar percentage (22%) was found by Bawa (1974) among 130 lowland tropical tree species, and in the tropical savannah, it was found that about 15% of woody species are dioecious (Oliveira 1996; Oliveira and Gibbs 2000). Studying tropical coastal vegetation, Matallana et al. (2005) found 14% dioecy among 566 species and a higher percentage (35%) among dominant woody plants. In general, the percentage of dioecy among tropical forest trees and shrubs varies between 16% and 28% (Queenborough et al. 2007).
Regenerating dioecious species
Table 5.5 gives the results obtained by studying the effect of reducing seed viability or the germination rate (u; v) of an accession initially containing Nf =Nm = 100 individuals or seeds. Functional female and male parents are P=uNf and M=vNm, respectively (Annex D, equations 16–18).
Suppose enough resources are available for a plant-to-plant crossing scheme between the Nf = 100 females and males, aimed at achieving a total number of offspring of at least t = 200. After planting the seed, it is verified that only 50 of the male and female plants germinated. If female and male gametic control is practiced (by hand-pollinating female plants using plant-to-plant crosses and by taking an equal number of seeds per female plant), the resulting effective size is Ne(v)= 133.3 (Table 5.5) for r = 0.5 in the offspring generation. Equation 18 gives this value by taking t = 200, M = P = 50, u = v = 0.5 and r = 0.5. To achieve Ne(v) = 200 under these conditions, the number of parents should be higher, namely P=M = 66.7, such that u=v=0.67. For P=M=70 and u= v = 0.7, Ne= 215 for r = 0.5 (Table 5.5). To reach Ne(v)= t = 200 and the initial sizes, the following number of functional parents of each sex (P=M) would be necessary: 66.7, 68.6, and 76.4, for sex ratios r = 0.5, r = 0.4 and r = 0.3, respectively. These results indicate that losses of 25% to 30% of plants in the field due to poor germination or to any environmental cause might be compensated for, at least in part, by female and male gametic control. If all female and male parents are used in the crossing block and no loss of plants has occurred, the effective population size is doubled for r = 0.5 and reaches Ne(v) = 369.2 and Ne(v) = 289.6 for r = 0.4 and r = 0.3, respectively, with gametic control on both sexes. All values given here refer to a sample size of t =200. As expected, when the sex ratio deviates from r = 0.5, there is a reduction in Ne(v).
Table 5.5: Variance Effective Population Size (Ne(v)) Values for Examples of Genebank Accession Regeneration with an Original Dioecious Reference Population with Nf = Nm = 100, under Random Mating, Assuming That t = 200 Offspring Are Sampled; Reducing Values of u and v (u = v); Three Sex-Ratio Levels (r = 0.3, r = 0.4 and r = 0.5) and Three Procedures of Gametic Control Random Sampling (RS), Female Gametic Control (FGC ) and Female Plus Male Gametic Control (FGC + MGC)
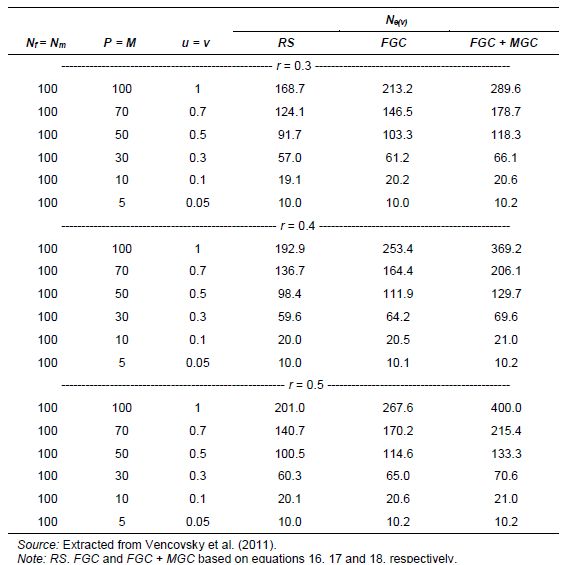
As an alternative to the previous examples, consider that of the Nf =100 only 33 are available. With a germination rate of only 50%, the remaining functional parents will be P =16 and M =50, such that u=0.16 and v=0.5. Since plant-to-plant crosses are not possible, male gametic control is not practicable and the option is to apply female gametic control. With these values and using equation 17, for t =200 and r =0.5, for the offspring generation, the resulting effective size is Ne(v)=51.7, which is relatively small due to the considerable reduction in the number of female parents and the impossibility of controlling the number of contributed male gametes. With the basic quantities remaining the same but a germination rate of 70%, P = (0.7)(33)![]() 23, M=(0.7)(100)=70, u=0.23 and v = 0.70, for a result of Ne(v)= 75.9.
23, M=(0.7)(100)=70, u=0.23 and v = 0.70, for a result of Ne(v)= 75.9.
When all individuals of the reference population are functional parents, the following values are obtained for t =f +m and r =0.5, Ne(v)=t for RS, Ne(v)=1.33t for FGC, and Ne(v)=2t for FMC+MGC (see Annex D, equations 19, 20 and 21).
Recommendations for regenerating dioecious species
Maintaining high levels of germination and viability is fundamental for preserving adequate Ne(v) values of accessions in genebanks. In the example,
-
a 20% increase in the germination rate leads to an increment of 24.2 units, or 46.8%, in Ne(v);
-
deviations of the sex ratio from r = 0.50 only have sizable effects on Ne(v) for larger values of u and v or when the viability of the accession is higher than 50% or 60%.
Collecting dioecious species
When collecting germplasm, the number of seed parents from which the seed samples are taken is, in general, a small fraction of the total population size, such that u tends to be small or negligible. In relation to the pollinator plants, the corresponding fraction v can also be smaller or larger than u, depending on the factors affecting pollen dispersal, the structure of the population and the size of the reference population.
Suppose that resources are available for collecting only t = 200 seeds, stemming from P = 100 female parents randomly crossed with M = 100 males within an ecogeographic area. Assume that the population of females and males is very large (Nf = Nm = 10,000) such that only 1% of the total population is sampled (u = v = 0.01), and that female gametic control is used. The expected population size will be Ne(v) = 115.1 (equation 17). For such small fractions u and v, the effective size is smaller than the sample size (t = 200) even with female gametic control (Table 5.6). Control of both types of gametes is rarely applicable in collection activities, but just for comparison, let us assume complete control of gametes. Effective size would then be Ne(v) = 134.2 (equation 18), with a gain of 16.6% relative to Ne(v) = 115.1. In this example, it was assumed that the sex ratio is r = 0.5 for both offspring and parents.
Table 5.6 shows some applications of equations 16 and 17, with a constant number of functional parents but a decreasing degree of representativeness (u = v) and increasing size of the reference population (Nf ; Nm). It is assumed that the sex ratio remains the same between generations. Here parameter r is included as a peculiarity of some species. As already seen in previous items, as r deviates from the value r = 0.5, Ne becomes smaller. It should also be noted that sampling 0.1% or 5.0% of individuals in the parental generation has little effect on Ne(v). Female gametic control is required for obtainingNe(v) = t, but the effect is noticeable only when u and v are large.
Estimating Ne(v) in dioecious species requires distinguishing the sex of the offspring. Since this is generally difficult or impossible in plant seedlings or seeds, some strategies are necessary. An indirect procedure is estimating r at the adult stage in a natural population and transferring this value to the offspring.
Another procedure is achieving some protection through gametic control. Establishing that a sample of t seeds should have an effective size Ne(v) ≥ t and if the entire set of parents participate in reproduction, the given condition will be achieved through female gametic control for a range of r values between 0.28 and 0.72. With control of both types of gametes (FGC+MGC), this range is increased to 0.21 ≤ r ≤ 0.79 gametic control. Therefore, gametic control is also important when the sex ratio is not known.
Recommendations for collecting dioecious species
As r deviates from the value r = 0.5, Ne(v) becomes smaller.
-
Female gametic control is required for obtaining increased values of Ne(v) ; however, the effect is noticeable only when the percentage of seed germination is large.
-
Sampling 5% or 0.1% of adult plants of the population for seed collection has negligible effect on Ne(v) .
Table 5.6: Variance Effective Population Size (Ne(v)) Values for Examples of Germplasm Collection in Dioecious Species, with Increasing Size of the Reference Random Mating Population (Nf ; Nm), a Constant Total Number of Parents (P+M=200) and a Reducing Fraction of Functional Parents Sampled (u and v). Total number of seeds collected: t=200.
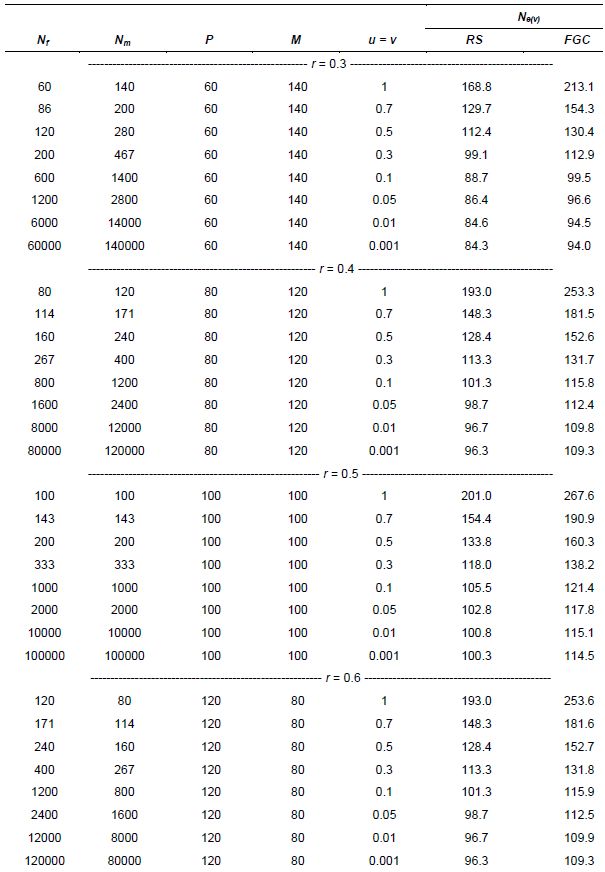
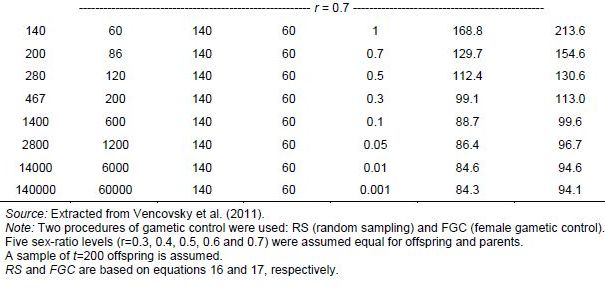
Sampling seeds from subpopulations
As already mentioned, there are situations in which seed samples are intended to represent a large population composed of subpopulations or fragments in natural conditions. In such a case, the number of subpopulations (S) is an additional sampling unit to be taken into account.
In this example, we consider that a sample of n =1000 seeds is taken from S subpopulations. We assume that an equal number of seeds (n/S) is sampled in bulk from each subpopulation and obtain Ne(v) values by applying equation 14 (Annex C). For evaluation, four degrees of genetic divergence due to drift among subpopulations (FST = 0.02, 0.05, 0.10 and 0.15) are incorporated. These subpopulations are considered to be in equilibrium with respect to the mating system, with a constant natural rate of self-fertilization (s), such that, within each one, the natural level of inbreeding is FIS = s/(2-s). The relationship (1-FIT)=(1-FST)(1-FIS) (Weir 1996) was used to obtain the total level of inbreeding FIT, which is also necessary for applying equation 14. To widen the example, we include two other potential situations, namely, (1) that the number of populations existing in the region is very large (S*= ∞ ) or (2) that this number is relatively small (S*=50). Pertinent Ne(v) values obtained for this example are given in Table 5.7. In equation 14, we considered that C2 = 0.
A striking outcome in this example is that Ne(v) is strongly dependent on the number S of subpopulations sampled. This can be seen even when the divergence among subpopulations is only a small fraction of the total genetic diversity, such as when it is only 2% (FST = 0.02). Effective size barely reaches Ne(v) =500 for s < 50 and S*= ∞ , under random mating within subpopulations (s = 0) and with a mixed mating system (s = 0.5). The degree of among-subpopulation divergence (FST) also shows a predominant influence upon Ne(v).
Equation 14 can be used for determining the number S necessary for obtaining a given Ne(v) value. If n is sufficiently large and S*= ∞ , this expression leads to S = 2FST Ne(v). If, for instance, FST = 0.05 and the desired Ne(v) is 1000, then the necessary number is S =100 for large n, such that (1+FIT)/2n is negligible.
When the reference population contains a finite set of subpopulations (S*= 50 in the example), the general trend remains the same. Effective size values for subpopulations with a mixed mating system (s = 0.5) are always smaller than the corresponding values obtained for s = 0, as was observed for the infinite model (S*= ∞ ). Also, in general, Ne(v) diminishes as among-subpopulation divergence (FST) increases. An exception occurs when all subpopulations are included in the sample (S = S*= 50). As expected, it is much easier to represent a population in a sample when it is composed of a finite set of subpopulations than when a population includes a very large number of subpopulations. Such results demonstrate the importance of clearly defining the reference populations when computing an Ne(v) value.
Table 5.7: Effective Size Ne(v)) Values for Examples of n=1000 Seeds Collected from S Subpopulations, for Increasing Among-Subpopulation Divergence (FST), Two Levels of Self-Fertilization (s) within Subpopulations and Two Models of Natural Population Size (S*)
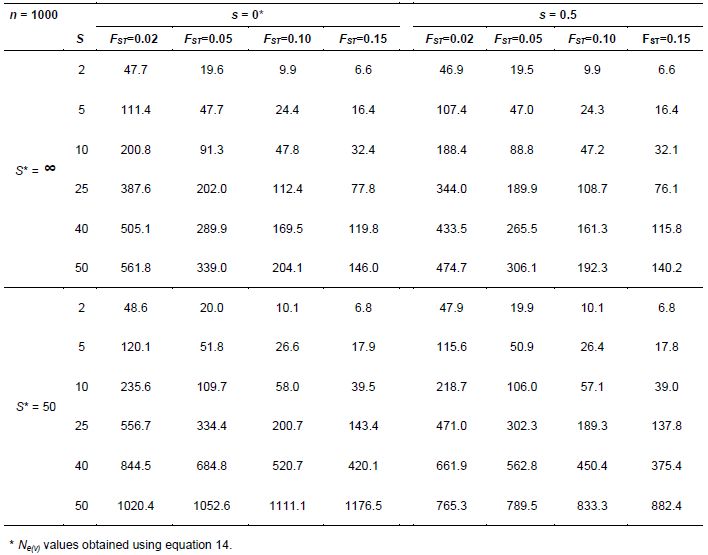
So far, we have stressed the importance of having a sufficient number S of subpopulations as sources for seed collection. In practice, we understand that such a sample of S subpopulations should not be taken at random. The fact is that, very often, adjacent subpopulations have a certain degree of genetic resemblance, a phenomenon detectable when genetic distances between all pairs of subpopulations are correlated with the corresponding geographic distances. This resemblance can be evaluated using morphological measurements or genetic data based on molecular markers. This technique involves estimating spatial autocorrelation, as shown by Sokal and Oden (1978a,b) and originally by Moran (1950). The ideal is to collect seeds from a subset S of subpopulations having the smallest possible degree of resemblance to each other. General results obtained by applying equation 14, as well as those given in Table 5.7, are applicable as strategies for in situ preservation.
-
Ne(v) is strongly dependent on the number S of subpopulations sampled.
-
The degree of among-subpopulation divergence (FST) also shows a strong influence upon Ne(v). Ne(v) diminishes as among-subpopulation divergence (FST) increases. An exception occurs when all subpopulations are included in the sample. As expected, it is much easier to represent a population in a sample when it is composed of a finite set of subpopulations than when a population includes a very large number of subpopulations.
-
It is important to define the reference populations when computing Ne(v).
-
When possible, collect seeds from a subset S of subpopulations having the smallest possible degree of resemblance to each other.
General recommendations
Regeneration and seed collection
-
Practicing female gametic control (harvesting an equal or approximately equal number of seeds per seed parent) is always recommended for all species.
-
When possible and especially for valuable materials, always obtain genetic information concerning the mating system of the species, based on molecular markers. This is especially important for species with mixed mating systems.
-
A computer programme for analysing marker data is available for this purpose: MLTR win (Multilocos Mating System Program) by Kermit Ritland (http://genetics.forestry.ubc.ca/ritland/programs.html).
Regeneration
-
Avoid a loss of viability or germination below 60%–70%during storage of germplasm accessions.
-
In addition to female gametic control, also apply male gametic control when species is a cross-fertilizer. This requires plant-to-plant hand pollination and is important for accessions that have low germination (high degrees of deterioration).
Collection
-
In the case of a single population, avoid harvesting large amounts of seeds from a small number of seed parents. This is valid for all species. To attain reasonable representativeness, harvest seeds from at least 25 seed parents for cross-fertilizing species and 50 seed parents for autogamous species.
-
In the case of large and genetically structured populations in natural conditions, seeds should be collected from the largest possible number of sites or subpopulations. This is recommended when no additional information is available about the genetic structure of the population.
-
When possible, always obtain measures of the genetic divergence among collection sites or subpopulations of the species in a given ecogeographic region, and of the level of natural inbreeding. This can be done as an activity parallel to collection. The following computer programmes are available for this purpose: FSTAT by Jérome Goudet (www2.unil.ch/popgen/softwares/fstat.htm) and GDA (Genetic Data Analyses) by Paul O. Lewis and Dmitri Zaykin: (http://hydrodictyon.eeb.uconn.edu/people/plewis/software.php).
Future challenges/needs/gaps
Making general considerations about future challenges in regeneration and collection activities is not simple. Every programme in the area of genetic preservation and conservation has its own peculiarities, objectives and difficulties. There are, however, some goals all curators have in mind when collecting seeds for a genebank. One is to apply strategies that permit obtaining the best possible samples under specific circumstances. We believe that this goal can be achieved when the strategies are developed on the basis of genetic information furnished by molecular markers. It is worth remembering how important this information can be for conservation activities. The following points can be clarified using molecular techniques:
-
the mating system
-
the degree of natural inbreeding
-
the level of genetic divergence among collection sites or subpopulations; area of seed and pollen dispersal; the degree of genetic relationship or coancestry between adult plants in natural conditions; the neighbourhood within which adults are genetically related
There are three basic units to be considered in seed collection:
-
the number of seeds per seed parent
-
the number of seed parents per subpopulation
-
the number subpopulations
Molecular genetic information allows one to find the ideal combination of these units for maximizing the representativeness of the seed sample. It also helps to define where the samples should be taken.
We understand that the collection of valuable materials or of populations endangered by human activity should be supported by estimates of the parameters of population genetics obtained from molecular markers. Along with the use of dense molecular markers, which are becoming cheaper with time, the use of valuable bioinformatics visualization tools and efficient biometrical-statistical methods are indispensable tools that can assist genebank curators in making appropriate decisions about optimum sampling strategies for regeneration, collection and subpopulation structures.
Acknowledgements
This work was partly funded by CNPq (the Brazilian Council for Scientific and Technological Development). The authors would like to thank Evandro V. Tambarussi and Fernando H. Toledo for their assistance.
Back to list of chapters on collecting
References and further reading
Allard RW. 1970. Population structure and sampling methods. In: Frankel OH, Bennett E, editors. Genetic Resources in Plants: Their Exploration and Conservation. Blackwell Scientific Publications, Oxford, UK. pp.97–107.
Bandel G, Gurgel JTA. 1967. Proporção do sexo em Pinheiro Brasileiro Araucaria angustifolia (Bert.) O. Ktze. Rev. Tec. Serv. Florestal do Est. de S. Paulo. Secr. Agr. Est. S. Paulo 6: 209–220.
Barret SCH, Yakimowsky SB, Field DL, Pickup M. 2010. Ecological genetics of sex ratios in plant populations. Philosophical Transactions of the Royal Society B. 365:2549–2557.
Bawa KS. 1974. Breeding systems of tree species of a lowland tropical community. Evolution 28(1):85–92.
Bawa KS. 1980. Evolution of dioecy in flowering plants. Annual Review of Ecology, Evolution, and Systematics 11:15–39.
Bawa KS, Perry DR, Beach JH. 1985. Reproductive biology of tropical lowland rain forest. I. Sexual systems and incompatibility mechanisms. American Journal of Botany 72(3):331–345.
Cockerham CC. 1969. Variance of gene frequency. Evolution 23:72–84.
Cockerham CC, Weir BS. 1984. Covariances of relatives stemming from a population undergoing mixed self and random mating. Biometrics 40:157–164.
Crossa J, Vencovsky R. 1994. Implications of the variance effective population size on the genetic conservation of monoecious species. Theoretical and Applied Genetics 89:936–942.
Crossa J, Vencovsky R. 1997. Variance effective population size for two-stage sampling of monoecious species. Crop Science 37:14–26.
Crossa J, Vencovsky R. 1999. Sample size and variance effective population size for genetic conservation. Plant Genetic Resources Newsletter 119:15–25.
Crossa J, Hernandez CM, Bretting P, Eberhart SA, Taba S. 1993. Statistical genetic considerations for maintaining germplasm collections. Theoretical and Applied Genetics 86:673–678.
Crow JF, Denniston C. 1988. Inbreeding and variance effective numbers. Evolution 42(3):482–495.
Crow JF, Kimura M. 1970. An Introduction to Population Genetics Theory. Burgess Publishing, Minneapolis, Minnesota.
Hernandez CM, Crossa J. 1993. A program for estimating the optimum sample size for germplasm conservation. Journal of Heredity 84:1.
Marshall DR, Brown AHD. 1975. Optimum sampling strategies in genetic conservation. In: Frankel OH, Hawkes JG, editors. Crop Genetic Resources for Today and Tomorrow. Cambridge University Press, Cambridge, UK.
Matallana G, Wendt T, Araujo DSD, Scarano FR. 2005. High abundance of dioecious plants in a tropical coastal vegetation. American Journal of Botany 92(9):1513–1519.
Moran PAP. 1950. Notes on continuous stochastic phenomena. Biometrika 37:17–33.
Namkoong G. 1986. Sampling for germplasm collections. Horticultural Science 23(1):79–81.
Oliveira PE. 1996. Dioecy in the cerrado vegetation of Central Brazil. Flora 191:235–243.
Oliveira PE, Gibbs PE. 2000. Reproductive biology of woody plants in a cerrado community of Central Brazil. Flora 195:311–329.
Queenborough SA, Burslem DFRP, Garwood NC, Valencia R. 2007. Determinants of biased sex ratios and inter-sex cost of reproduction in dioecious tropical forest trees. American Journal of Botany 94(1):67–78.
Sebbenn AM. 2006. Sistema de reprodução em espécies tropicais e suas implicações para a seleção de árvores matrizes para reflorestamentos ambientais. In: Higa AR, Silva LD, editors. Pomares de Sementes de Espécies Florestais Nativas. Fundação de
Pesquisas Florestais do Paraná (FUPEF), Curitiba, Brazil. pp.93–108.
Sokal RR, Oden NL. 1978a. Spatial autocorrelation in biology. 1. Methodology. Biological Journal of the Linnean Society 10:199–228.
Sokal RR, Oden NL. 1978b. Spatial autocorrelation in biology. 2. Some biological implications and four applications of evolutionary and ecological interest. Biological Journal of the Linnean Society 10:229–249.
Vencovsky R. 1978. Effective size of monoecious populations submitted to artificial selection. Brazilian Journal of Genetics 1(3):181–191.
Vencovsky R, Crossa J. 1999a. Variance effective population size under mixed self and random mating with applications to genetic conservation of species. Crop Science 39:1282–1294.
Vencovsky R, Crossa J. 1999b. Medidas de representatividad. Workshop O Melhoramento de Plantas na Virada do Milenio. Universidad Federal de Vicosa, MG, Brasil.
Vencovsky R, Crossa J. 2003. Measurements of representativeness used in genetic resource conservation and plant breeding. Crop Science 43:1912–1921. doi:10.2135/cropsci2003.1912.
Vencovsky R, Nass LL, Cordeiro CMT, Ferreira MAJF. 2007. Amostragem em recursos genéticos vegetais. In: Nass LL, editor. Recursos Genéticos Vegetais. Embrapa, Brasília.
Vencovsky R, Chavez L, Crossa J. 2011. Variance effective population size for dioecious species. Crop Science (in press).
Viegas MP, Silva CLSP, Moreira JP, Cardin LT, Azevedo VCR, Ciampi AY, Freitas MLM, Moraes MLT, Sebbenn AM. 2011. Diversidade genética e tamanho efetivo de duas populações de Myracrodruon urundeuva fr. all., sob conservação ex situ. Revista Árvore 35(4):769–779.
Weir BS. 1996. Genetic Data Analysis II - Methods for Discrete Population Genetic Data. Sinauer Associates, Sunderland, Massachusetts.
Wright S. 1931. Evolution in Mendelian populations. Genetics 16:97–159.
MLTR (Multilocos Mating System Program) by Kermit Ritlan (a computer programme for analysing marker data): http://genetics.forestry.ubc.ca/ritland/programs.html
Resources for obtaining measures of genetic divergence among collection sites or subpopulations of a species in a given ecogeographic region, and of the level of natural inbreeding:
FSTAT by Jérome Goudet: www2.unil.ch/popgen/softwares/fstat.htm
GDA (Genetic Data Analyses) by Paul O. Lewis and Dmitri Zaykin: http://hydrodictyon.eeb.uconn.edu/people/plewis/software.php
Annex A: Two-stage sampling model for random-mating species
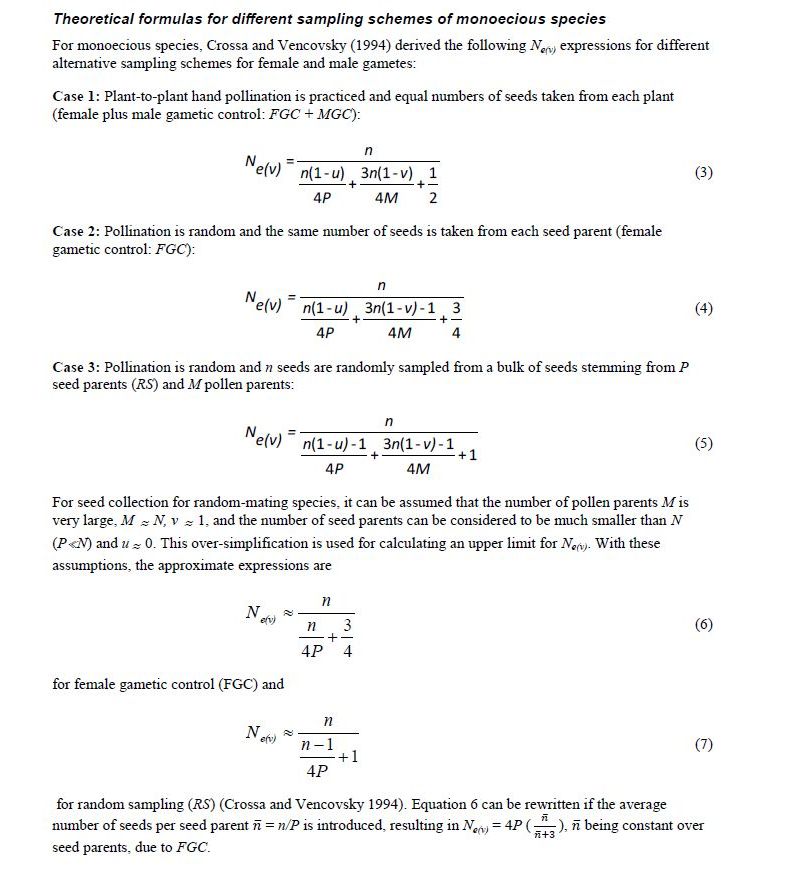
Annex B: Two-stage sampling model for mixed self- and
random-mating species
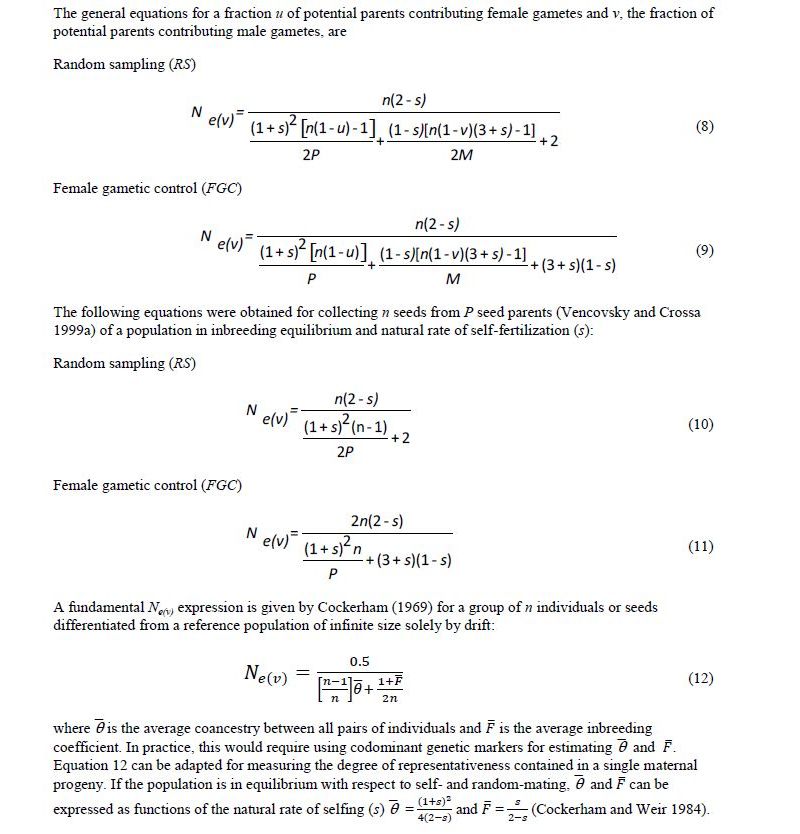
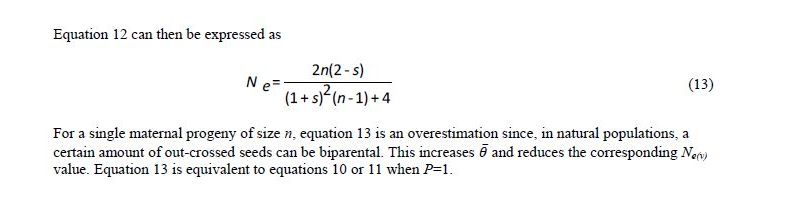
Annex C: Seed collection from several subpopulations
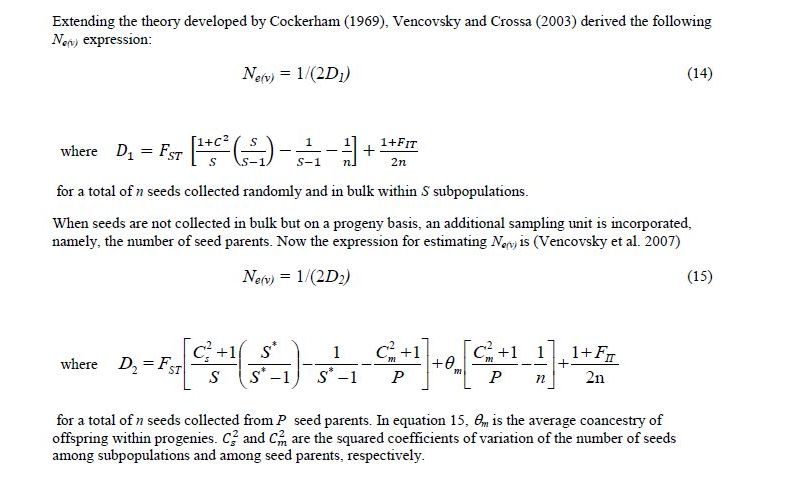
Annex D: Two-stage sampling model for dioecious species
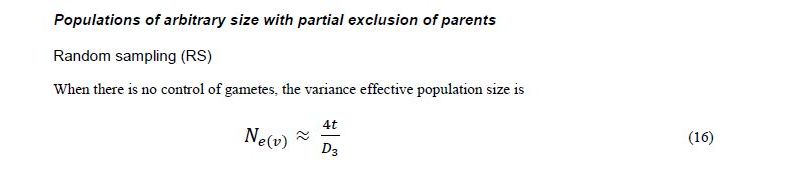
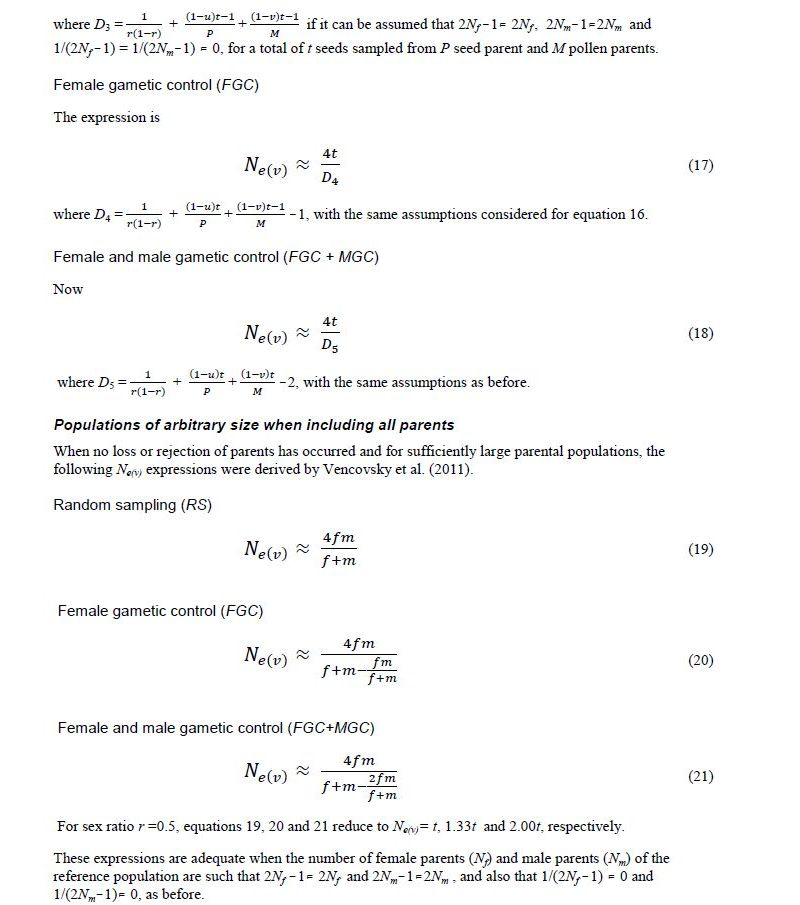
Chapter 18: Collecting plant genetic resources and documenting associated indigenous knowledge in the field: a participatory approach
P. Quek
Bioversity International Asia, Pacific and Oceania Regional Office Serdang, Malaysia
E-mail: p.quek(at)cgiar.org
E. Friis-Hansen
Danish Institute for International Studies (DIIS, Politics and Governance Group), Strandgade 56, DK-1401 Copenhagen, Denmark
E-mail: efh(at)diis.dk
|
2011 version |
1995 version |
||
|
Open the full chapter in PDF format by clicking on the icon above. |
|||
This chapter is a synthesis of new knowledge, procedures, best practices and references for collecting plant diversity since the publication of the 1995 volume Collecting Plant Diversity; Technical Guidelines, edited by Luigi Guarino, V. Ramanatha Rao and Robert Reid, and published by CAB International on behalf of the International Plant Genetic Resources Institute (IPGRI) (now Bioversity International), the Food and Agriculture Organization of the United Nations (FAO), the World Conservation Union (IUCN) and the United Nations Environment Programme (UNEP). The original text for Chapter 18: Collecting Plant Genetic Resources and Documenting Associated Indigenous Knowledge in the Field: A Participatory Approach, authored by L. Guarino and E. Friis-Hansen, has been made available online courtesy of CABI. The 2011 update of the Technical Guidelines, edited by L. Guarino, V. Ramanatha Rao and E. Goldberg, has been made available courtesy of Bioversity International.
Please send any comments on this chapter using the Comments feature at the bottom of this page. If you wish to contribute new content or references on the subject please do so here.
Back to list of chapters on collecting
Internet resources for this chapter
|
|
|
|
From top to bottom: Documentation by Iban, Rh Emak - Field Documentation with Melanau, Mukah - Herbarium Preparation (Kenyah, Long Pelutan) - Empowering the older generation (Bidayuh, Kpg Semban) |
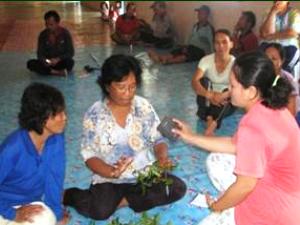
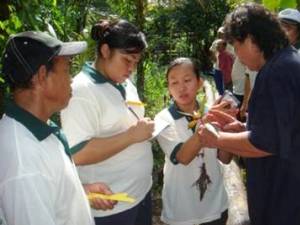
Abstract
Over the past 15 years, there has been a paradigm shift in participatory approaches to collecting traditional knowledge associated with plant genetic resources from extracting knowledge for a scientist to use to a focus on how local communities can benefit from involvement with scientists. This reflects an increasing recognition of the fundamental role that farmers continue to play in generating and maintaining the diversity of landraces.
During this period, the plant genetic resource community has shifted emerging recognition of the value of traditional knowledge to general acceptance that a comprehensive approach, such as the methodology of a traditional knowledge journal (TKJ) is needed. This methodology shifts the control of the documentation from the scientist to the community itself. Before collecting ethnobotanical data, scientists play a role in empowering farmers and communities to document their knowledge by themselves. Then, the scientists seek permission to jointly use the knowledge documented. Prior informed consent and material transfer agreements are now an inherent part of ethnobotanical data collecting. The role of ex situ and in situ conservation has taken a new direction with an increased understanding of the links between local culture and the conservation of plants by the community.
Introduction
The 1995 version of this chapter provided an introduction to participatory techniques for collecting the indigenous (traditional) knowledge associated with plant genetic resources. In the mid-1990s the use of social science methods in the plant genetic conservation community was a novelty, and the 1995 chapter provided an overview of the two methodologies widely known at the time – rapid rural appraisal (RRA) and participatory rural appraisal (PRA) – and how these participatory techniques could be used in the “memory banking approach” (Sandoval 1994) to document indigenous knowledge as part of genetic resource conservation. The 1995 chapter discussed more informant-led approaches to collecting indigenous knowledge about plant genetic resources, including the use of local gatekeepers and cognitive mapping of landraces.
Since 1995, participatory approaches have become the mainstream in most aspects of development assistance (for an overview see Friis-Hansen and Kyed 2009). There has been an overall shift from using participation in an instrumental way (to involve the community and extract knowledge in ways defined by external actors) to using participation as part of the community-empowerment process, often in conjunction with more instrumental approaches. Participatory methods for documenting traditional knowledge for plant genetic resources has also shifted direction – from the extraction of knowledge for the use of scientists to a focus on how local communities can benefit from involvement with the scientists. The methodology of a traditional knowledge journal (TKJ) addresses documentation needs at the community level and facilitates its use by scientists. TKJ has been supported by Bioversity International over the last decade; however, this support has mostly been at project conferences. The approach has not yet become an integrated part of the collection of plant genetic resources.
Current status
The process of documenting the traditional knowledge of communities about plant genetic resources can be perceived as exploitation when communities do not benefit from it. The main issues include language, recognition and protection (Quek et al. 2009).
From the community’s perspective, the data collected and the papers produced are in the scientist’s language, so the content is not available to the community. When scientists finish their work, there are usually no funds provided for any translation to benefit the community, and the community loses the possibility of complementing their indigenous knowledge with the scientific knowledge. For the scientists, the knowledge they have captured is in a translated or filtered form and makes reinterpretation difficult, and the original source of the knowledge might no longer be available. In addition, there is no recognition of the farmer as the source of the knowledge.
Before scientists can use the knowledge of communities that have oral traditions, they need to assist the community in documenting this knowledge in their own language for their own use. Then the community’s knowledge may only be used with a citation. This process avoids the one-sided approach where traditional knowledge (TK) is studied without any benefit to the community. The TKJ methodology was developed on the premise that farmers and community members have knowledge that is valid for scientific use and that empowering farmers to do their own documentation addresses the problem of knowledge erosion and enables scientists to have access to the information.
This methodology was first proposed by Quek and Zhang (1997) and has since been developed further and used by several organizations in the Asian region. Figures 18.1 and 18.2 illustrate the methodology, which was also described by Padulosi et al. (2002).
The process starts with the scientist helping the farmer to develop a paper that is authored by the farmer and acknowledges the scientist’s assistance. The scientist then develops his or her interpreted version of the paper or collects the ethnobotanical data and cites the farmer’s paper after obtaining permission to use it. The farmer’s paper can be in any format –from paper for those who can write to audio and video tapes.
Having the farmers’ knowledge documented in their own language enables communities to reuse their traditional knowledge in a manner that is similar to the way scientific communities reuse their knowledge. The farmer is recognized as the author of the paper because the scientist and others will cite it as the source of the information. This allows cultural and social information to become available to be validated by the community for reuse; other farmers can react as well. Knowledge captured in the farmer’s paper is the original source and therefore can be reinterpreted by different scientists if the community allows. This makes reinterpretation of the knowledge possible as science progresses.
 |
 |
|
Figure 18.1: The farmer’s journal |
Figure 18.2: Re-using knowledge |
The question one might ask is why we should be concerned about the traditional knowledge of the community when what we are really interested in is data for the conservation of the materials. The answer is that an understanding of the community’s knowledge will provide an understanding of the conservation of plant genetic resources in situ.
At the subsistence level, where most farmers are illiterate, their knowledge is usually passed on by word of mouth. Traditional groups of people have devised different methods of preserving their knowledge by embedding it in folklore, songs and sayings, as well as in their cultural arts and practices. In the process, one can expect the information to change along the way as some information will undoubtedly be omitted or added. Thus, any documentation has to take into account the possibility of such changes over time.
Table 18.1 shows the outcome of the oral tradition of knowledge transmission:
-
The knowledge is lost when the knowledge holder passes away.
-
The knowledge becomes threatened if there are no recipients for it (e.g., the younger generation is no longer interested).
-
The knowledge becomes unwanted (e.g., when it is easier to access commercial drugs than herbs).
-
The knowledge becomes just a story when the plants and/or materials used are no longer available (e.g., when they become extinct).
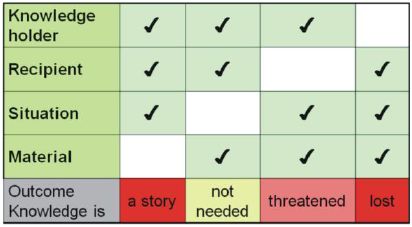 |
|
Table 18.1: A Missing Component in Knowledge Transmission |
Empowering communities to document their knowledge helps to promote in situ conservation because they then become more interested in maintaining their plant genetic resources. It also validates their knowledge and helps to promote the sharing of knowledge among the community, especially among the youth and children (Naming et al. 2010).
It is extremely important to think about the process prior to community participation. The experiences described here are based on work carried out by the Yunnan Academy of Agricultural Sciences (YAAS) (Dai et al. 2008), the Kyanika Adult Women’s Group (KAWG), the Sarawak Biodiversity Centre (SBC) and the Platform for Agrobiodiversity Research-Climate Change (PAR-CC) project. SBC has 10 years of experience in implementing the TKJ methodology, and they have developed a framework (figure 18.3) that is workable and well received by the ethnic communities (Naming et al. 2010; Tu et al. 2010).
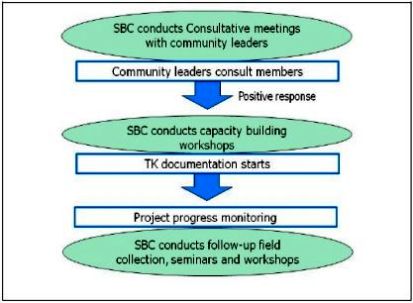 |
|
Figure 18.3: Documentation framework for traditional knowledge used by the Sarawak Biodiversity Centre (SBC). Source: Tu et al. (2010) |
The documentation process
For the long term, it is good to have communities develop their own vision and mission statements for their reasons for conserving their knowledge. A form for prior informed consent (PIC) will need to be signed by both the community and the scientist. A sample PIC, which was used by PAR-CC, is shown in the box below. It conforms to the code of ethics of the International Society of Ethnobiology (see http://ethnobiology.net/code-of-ethics).
The community should start by making an inventory of plants. It is important to have the list of plants validated by the community in order to clarify names (e.g., a plant can be known by more than one name and, in some cases, a name might be used for more than one plant). To assist in the validation process, members of the community are taught how to make herbarium specimens, which are useful during the documentation process because they provide a framework for the expert to talk on. Experts on various plants are identified by the community, based on the inventory.
Oral documentation can be made on simple tape recorders and video recorders. With the plant specimen in front of the expert, he or she is asked, “What do you want to tell your grandchildren about this plant?” This process allows the community to document their knowledge in a way they are comfortable with. It also facilitates recall and helps ensure the completeness of the knowledge recorded.
The community is encouraged to develop their own ethnobotanical garden so that the children can use the tapes to learn about the useful plants and to maintain knowledge within the community. The process helps to ensure that the knowledge is at least conserved within the community and that it will be available for sharing when the community is ready to share. It also allows the knowledge to evolve over time. In communities where herbalists might claim that their knowledge is a secret, it is still important to emphasize that they should document the knowledge and keep it so that at their death, the knowledge can still be handed over to whoever they have chosen. Otherwise, the cliché “a library is burnt when an elder passes away” becomes a reality.
This gives the community ownership of the knowledge documented; they even have the right to deny the scientists permission to access the knowledge.
Future challenges/needs/gaps
The TKJ methodology may seem to put a hurdle before the scientist collecting ethnobotanical data. The need to assist the community in documenting their traditional knowledge might seem to make their job harder, and the significant increase in cost in terms of both human and financial resources is likely to be the main challenge for widespread use of the TKJ methodology. In the long run, however, once the community has documented their knowledge, then collecting ethnobotanical data becomes similar to conducting a literature review on the plant concerned. Any missing information can be discussed with the knowledge holder, building up the knowledge within the community at the same time.
The process reduces knowledge erosion, and the merging of traditional and scientific knowledge into a common citation system can be realized. This not only provides recognition of the knowledge holder but also empowers the community.
With the documentation system in place, the community will need tools to manage the knowledge it wishes to share. We need to find ways of using information technology to assist the community in creating a database of traditional knowledge.
Access and benefit sharing is a gap that we need to close so that communities feel comfortable with the sharing process. At present only the material transfer agreement (MTA) of the International Treaty on Plant Genetic Resources for Food and Agriculture is available, but a simple model is needed – one that is understandable and implementable by the community.
|
Prior Informed Consent Template This PIC is proposed by < “Research staff” has the meaning of any staff working for or under the instruction of the research organization. “Community” is any member of the < < The Research Organization (RO) seeks the consent of the Community to carry out the above activity in the community on the following terms: 1. Research staff will abide by the traditional practices in the community with respect to knowledge sharing and documentation of the shared knowledge.
|
There is also concern about the loss of traditional knowledge as a result of changing lifestyles, changing priorities, the availability of modern amenities and diminishing dependence on natural resources among indigenous communities (Manurung et al. 2010). An additional concern is rural-urban migration, which poses challenges for communities with closed cultural links to their plants. Moving away from their communities risks the loss of their traditional varieties, especially heirloom varieties, as their culture erodes. Based on the PAR-CC project in Sarawak, where heirloom varieties of rice are maintained by households, based on their culture, there is a need to find ways to allow households to conserve their heirloom seeds longer than they do with traditional methods so that they can move to urban areas for short periods to be with their children and then return to continue their rice-growing culture. It is also possible that genebanks could provide a form of “seed hotel” service so that unclaimed heirloom varieties could be integrated into the national collection, especially for heirloom varieties not shared outside the family.
Issues of knowledge ownership need to be addressed because members of the community might claim individual ownership for knowledge not known to others in the community. This will have an impact on future access and benefit sharing and will need to be resolved to ensure knowledge ownership by the community.
National programmes around plant genetic resources should be stimulated to use the TKJ as an integrated part of their collecting methodology. Experience with attempts to use participatory approaches to collection of local knowledge, such as TKJ, in connection with collection missions, should be evaluated. The TKJ methodology actually prepares the community before the germplasm collection begins and facilitates the use of PRA tools and other assessment methods familiar to scientists.
Conclusions
Within the past decade and a half, the plant genetic resource community has moved from accepting traditional knowledge as a valuable source of information, to embracing the TKJ methodology, which places control over the knowledge is compiled and access to it in the hands of the community rather than the scientist.
The TKJ methodology addresses the need for documentation at the community level and facilitates its use by scientists. It is a step that comes before the scientist’s use of the knowledge and allows the information to be cited. Communities involved in such work will also be involved in conservation at the community level, which will reduce knowledge erosion and facilitate future access to valuable information about plant genetic resources.
Back to list of chapters on collecting
References and further reading
Ceccarelli S, Guimarães EP, Weltizien E, editors. 2009. Plant Breeding and Farmer Participation. Food and Agriculture Organization of the United Nations, Rome.
Dai L, Chengli You, Quek P. 2008. Indigenous Knowledge and Agro-Biodiversity. China Science Press, Beijing.
Friis-Hansen E, Bhuwon S, editors. 2000. Participatory Approaches to the Conservation and Use of Plant Genetic Resources. International Plant Genetic Resource Institute, Rome.
Friis-Hansen E, Kyed MH. 2009. Participation, Decentralization and Human Rights: A Review of Approaches for Strengthening Voice and Accountability in Local Governance. Social Development Department, the World Bank, Washington DC.
Manurung R, Naming M, Tu CL. 2010. Traditional knowledge of genetic resources: its documentation and conservation. In: Mirfat AHS, Salma I, Mohd Rani MY, Mohd Norowi H, Mohd Shukri MA, Erny Sabrina MN, Noor Sarinah MN, Siti Noor Aishikin AH, Nor Asiah I, editors. Second National Conference on Agrobiodiversity Conservation and Sustainable Utilization, Agrobidiversity for Sustainable Economic Development. Malaysian Agricultural Research and Development Institute (MARDI), Malaysia. pp.53.
Naming M, Yu RA, Tu CL. 2010. Traditional knowledge conservation and transmission of agrobiodiversity: sharing of experiences by the Penan community in Mulu Sarawak. In: Mirfat AHS, Salma I, Mohd Rani MY, Mohd Norowi H, Mohd Shukri MA, Erny Sabrina MN, Noor Sarinah MN, Siti Noor Aishikin AH, Nor Asiah I, editors. Second National Conference on Agrobiodiversity Conservation and Sustainable Utilization, Agrobidiversity for Sustainable Economic Development. Malaysian Agricultural Research and Development Institute (MARDI), Malaysia. pp.54.
Padulosi S, Leaman D, Quek P. 2002. Challenges and opportunities in enhancing the conservation and use of medicinal and aromatic plants. Journal of Herbs, Spices and Medicinal Plants 9(4): 243–267. And in: Johnson CB, Franz C, editors. Breeding Research on Aromatic and Medicinal Plants. The Haworth Herbal Press, Abingdon, UK. pp.243-267.
Quek P, Lim ES. 2008. Possible approaches for protection and sharing of traditional knowledge for Malaysia communities. In: Mohd. Shukor Nordin, Salma Idris, Mohd. Said Saad, editors. Agrobiodiversity in Malaysia. Malaysian Agricultural Research and Development Institute (MARDI), Malaysia. pp.141–149.
Quek P, Zhang Z. 1997. Documenting indigenous knowledge: the need for an IK journal. IPGRI-APO Newsletter No.23, August.
Quek P, Manurung R, Naming M, Kimonyi JM, Dai L, Abraham M, Eyzaguirre P, Morimoto Y, Maundu P, Zhang Z. 2009. The traditional knowledge journal (TKJ) methodology empowers communities to document their traditional knowledge. Poster presentation at Knowledge ShareFair for Agricultural Development and Food Security, 20–22 January 2009. Bioversity International, Rome.
Sandoval VN. 1994. Memory banking protocol: a guide for documenting indigenous knowledge associated with traditional crop varieties. In: Prain GD, CP Bagalanon, editors. Local Knowledge, Global Science and Plant Genetic Resources: Towards a Partnership. Proceedings of the International Workshop on Genetic Resources. UPWARD, Los Baños. pp.102–122.
Tu, CL, Naming M, Jovita ER. 2010. Sarawak’s experience – documenting traditional knowledge of useful plants among Sarawak’s indigenous communities. In: Manurung R, Abdullah ZC, Ahmad FB, Kuek C, editors. Biodiversity- Biotechnology: Gateway to Discoveries, Sustainable Utilization and Wealth Creation. Proceedings of the International Symposium, Kuching Sarawak, Malaysia, 19–21 November 2008. Sarawak Biodiversity Centre (SBC), Kuching, Malaysia. pp.112–116.
AGP Knowledge Resources, Plant Production and Protection Division, FAO: www.fao.org/agriculture/crops/core-themes/theme/seeds-pgr/know_res/en
Participation (online courses, discussion, etc.), Informal Working Group on Participatory Approaches & Methods, FAO: www.fao.org/Participation
Literature review of stakeholder participation, Sustainable Development Department, FAO: www.fao.org/sd/PPdirect/PPre0074.htm
Participatory Methodologies, Institute of Development Studies: www.ids.ac.uk/go/research-teams/participation/-power-and-social-change-team/participation-themes/participatory-methodologies
International Society of Ethnobiology: http://ethnobiology.net
International Society of Ethnobiology Code of Ethics: http://ethnobiology.net/code-of-ethics
Other resources
For training in TKJ methodology for scientists and community members, contact
Chief Executive Officer
Sarawak Biodiversity Centre (SBC)
KM20 Jalan Borneo Heights Semengoh
Locked Bag No. 3032
93990 Kuching, Sarawak, Malaysia
Tel: +60 8 2 610610
Fax: +60 2611535
E-mail: tk(at)sbc.org.my
More Articles...
- Chapter 28: Processing of germplasm, associated material and data
- Chapter 3. An introduction to plant germplasm exploration and collecting: planning, methods and procedures, follow-up
- Chapter 41: Gap analysis: A tool for genetic conservation
- Chapter 14: Ecogeographic surveys
- After Vavilov: Collecting germplasm in the 21st century
- Chapter 4: Assessing the threat of genetic erosion
- Chapter 23: Collecting woody perennials