


Chapter 41: Gap analysis: A tool for genetic conservation

N. Maxted
School of Biosciences University of Birmingham, Edgbaston Birmingham, UK
E-mail: n.maxted(at)bham.ac.uk
N. P. Castañeda Álvarez
International Center for Tropical Agriculture (CIAT)—Bioversity International Cali, Colombia and School of Biosciences University of Birmingham, Edgbaston Birmingham, UK
E-mail: n.p.castaneda(at)cgiar.org
H. A. Vincent
School of Biosciences University of Birmingham, Edgbaston Birmingham, UK
E-mail: holly.vincent(at)gmail.com
J. Magos Brehm
School of Biosciences University of Birmingham, Edgbaston Birmingham, UK
E-mail: joanabrehm(at)gmail.com
|
|
|||
|
Open the full chapter in PDF format by clicking on the icon above. |
|||
.jpg)
This chapter is a synthesis of new knowledge, procedures, best practices and references for collecting plant diversity since the publication of the 1995 volume Collecting Plant Diversity: Technical Guidelines, edited by Luigi Guarino, V. Ramanatha Rao and Robert Reid, and published by CAB International on behalf of the International Plant Genetic Resources Institute (IPGRI) (now Bioversity International), the Food and Agriculture Organization of the United Nations (FAO), the World Conservation Union (IUCN) and the United Nations Environment Programme (UNEP). The 2011 update of the Technical Guidelines, edited by L. Guarino, V. Ramanatha Rao and E. Goldberg, has been made available courtesy of Bioversity International.
Please send any comments on this chapter using the Comments feature at the bottom of this page. If you wish to contribute new content or references on the subject please do so here.
Back to list of chapters on collecting
Internet resources for this chapter
Abstract
Gap analysis is a well-established conservation technique used by ecological conservationists to identify areas in which selected elements of biodiversity are represented. Through comparison with existing in situ protected-area networks, it identifies habitats or ecosystems that need additional protection. However, the methodology has recently been adapted for application in the context of broader agro-biodiversity conservation, to encompass both in situ and ex situ strategies for conserving genetic diversity. The extended methodology involves the following steps: (a) circumscription of target taxon and target area, (b) assessment of natural diversity through a review of intrinsic taxonomic, genetic and ecogeographic diversity combined with threat assessment, (c) assessment of current complementary between in situ and ex situ conservation strategies, (d) reformulation of the conservation strategy through analysis of the differences between the pattern of natural, intrinsic diversity and the elements of that diversity already effectively represented by existing in situ and ex situ conservation actions. The methodology is reviewed and illustrated using various temperate and tropical examples of crop wild relatives and landraces.
Introduction
When the original text for chapter 14 of these Technical Guidelines, on ecogeographic surveys, was being prepared, knowledge of the early application of ecological gap analysis was limited and still in the early stages of development (Burley, 1988; Margules et al., 1988; Margules, 1989; Pressey and Nicholls, 1989; Pressey et al., 1993). However, an extensive literature on “gap analysis” (i.e., how to identify areas in which selected elements of biodiversity are underrepresented) has subsequently arisen, including Margules and Pressey (2000) Balmford (2003), Brooks et al. (2004), Lipow et al. (2004), Dietz and Czech (2005), and Riemann and Ezcurra (2005). Although within the wider conservation community, the literature on gap analysis was originally and is still primarily applied to indigenous forests (particularly on small islands rich in endemic species), the technique has recently been extended to agro-biodiversity conservation, encompassing conservation strategies for both in situ and ex situ genetic diversity. Maxted et al. (2008a) showed how the existing methodology might be adapted for more general conservation use and proposed a specific methodology. Subsequently, gap analysis has rapidly established itself as the methodology for conservation planning (FAO, 2009; Maxted and Kell, 2009; Parra-Quijano et al., 2012a; Ramírez-Villegas et al., 2010). As stressed in the update of chapter 14 on ecogeographic surveys, the current application of gap analysis techniques is not replacing ecogeography; it has, in effect, subsumed ecogeography as an element within the broader, more schematic gap analysis protocol. As such, ecogeographic surveys will continue to be routinely undertaken, but increasingly within the broader context of gap analysis. Therefore, chapter 14 can be seen as a sister chapter to this chapter, which specifically addresses gap analysis and should be read in conjunction with that chapter. Both ecogeographic surveys and gap analysis form essential components in planning for plant genetic-resource conservation.
The basic premise of gap analysis is that the target taxon’s ecogeographic and genetic distribution and diversity are compared with the elements that are currently actively conserved.1 The “gap” is therefore the component of the target taxon’s ecogeographic and genetic distribution and diversity that is not currently actively conserved and which becomes the conservation priority. As such, the protocol for genetic gap analysis involves four steps: (a) circumscription of taxa, (b) identifying the breadth of ecogeographic and genetic distribution and diversity for the target taxa, (c) matching current in situ and ex situ conservation actions with the breadth of ecogeographic and genetic distribution and diversity to identify the conservation “gaps” and (d) formulating a revised in situ and ex situ conservation strategy (Maxted et al., 2008a).
1 “Active conservation” is where the target taxon population is specifically managed to maintain its diversity, as opposed to “passive conservation” where the site is managed and it is hoped that the target taxon population benefits from the general site-based management.
Current status
Circumscription of target taxon and target area
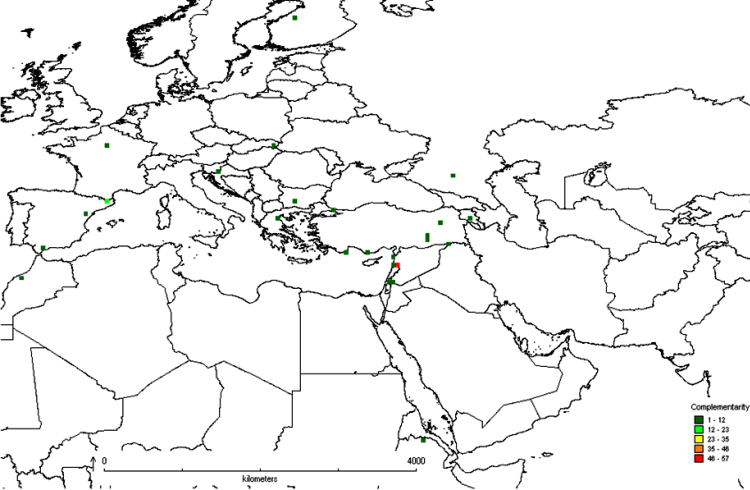
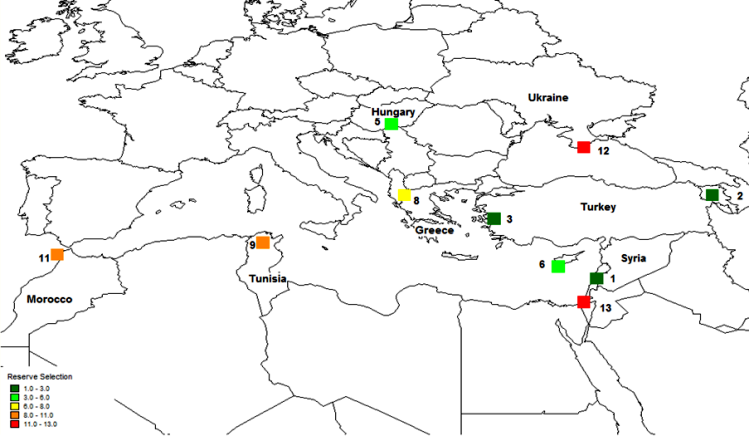
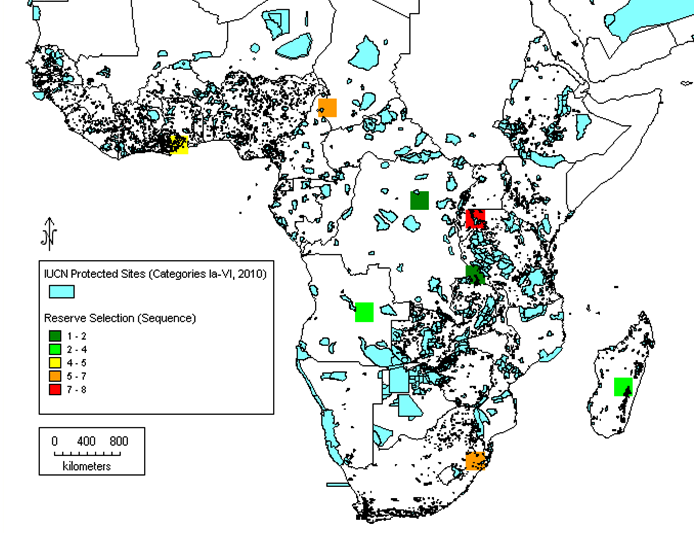
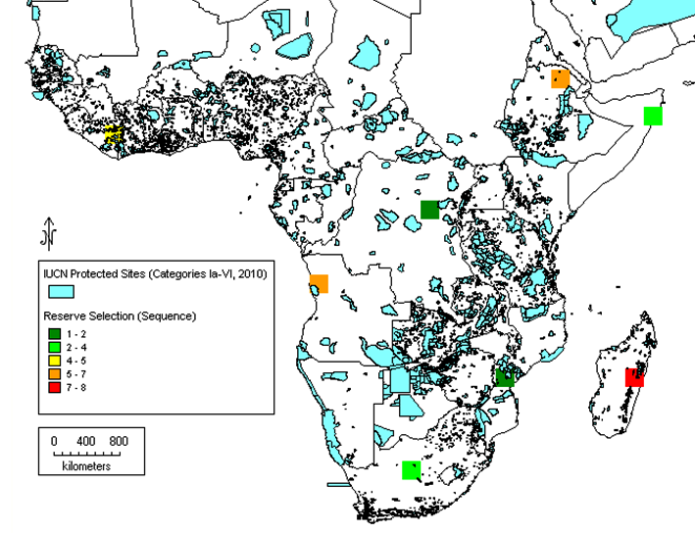
The first step in the gap analysis protocol is to establish the taxonomic (e.g., genus, section or species) and geographic (e.g., global, regional, country or provincial) breadth of the analysis. The approach that has largely been applied thus far is for individual analyses to focus on distinct crop genepools, see Maxted et al. (2005), Maxted et al. (2008b) and the CIAT-IRRI-Bioversity International GapAnalysis project (http://gisweb.ciat.cgiar.org/gapanalysis). However, in terms of establishing in situ and ex situ conservation priorities, it might be of greater practical value and more cost efficient to establish multi-genepool conservation targets irrespective of individual genepool results, so collection or establishing genetic reserves is led by overall targets for plant genetic resources. This multi-genepool approach was taken by Maxted et al. (2012) for the temperate legume genera Cicer, Lathyrus, Lens, Medicago, Pisum and Vicia species (see figure 41.1) and by Whitehouse (2011) for the in situ conservation of temperate cereal genera Avena, Aegilops, Hordeum, Secale and Triticum (see figure 41.2). Interestingly, both the legume and cereal analysis showed the area at the northern end of the Bekaa Valley in Lebanon and Syria to be a target for in situ and ex situ conservation action for both wild legumes and cereals. Both analyses showed some coincidence between undertaking the analysis for each genepool separately and the combined legume or cereal analyses, but for the legumes, the chickpea and the oat genepools, the individual analyses were quite distinct from the combined analyses.
 |
|
Figure 41.1: Complementarity analysis for Cicer, Lathyrus, Lens, Medicago, Pisum and Vicia species. |
 |
|
Figure 41.2: Complementary analysis Avena, Aegilops, Hordeum, Secale and Triticum species. |
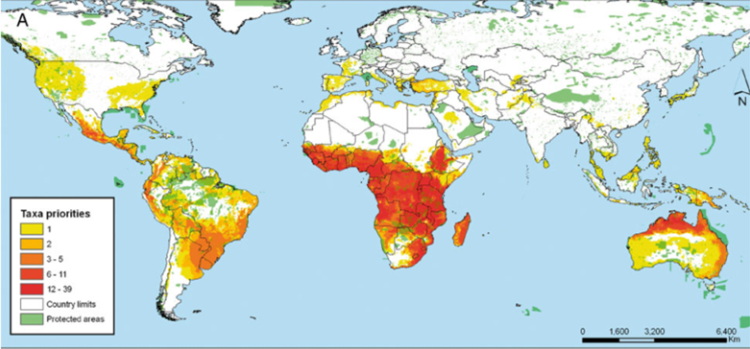
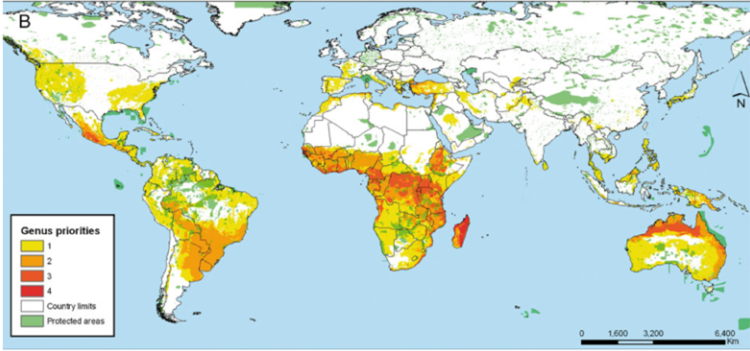
Further, the International Center for Tropical Agriculture (CIAT) in collaboration with the International Rice Research Institute (IRRI) and Bioversity International undertook a gap analysis to identify the gaps in the ex situ collections of the crop wild relatives (CWR) of 13 crop genepools2 (figure 41.3) (see http://gisweb.ciat.cgiar.org/gapanalysis), using all the species in the genus as the basis of the analysis. The conclusion was that if overall conservation of plant genetic resources is the aim, combining genepools for analysis may be an effective technique for identifying the highest priority sites but individual genepool priorities might be missed where the included taxa deviate from the combined norm, so a combination of using the individual and combined genepool approach is recommended.
2 Pigeon pea (Cajanus), chickpea (Cicer), finger millet (Eleusine), barley (Hordeum), lentil (Lens), pearl millet (Pennisetum), bean (Phaseolus), sorghum (Sorghum), wheat (Triticum and Aegilops), faba bean (Vicia), cowpea (Vigna) and maize (Zea).
 |
 |
|
Figure 41.3: Priorities for in situ and ex situ conservation of the crop wild relatives of 13 genepools: |
In the case of the CIAT study, a large number of taxa and areas were identified as priorities for conservation. As seen in figure 41.3, the number of taxa requiring further conservation is concentrated in a wide proportion of the African continent and northern Australia. When these priorities are summarized at the genus level, places where four different genera are potentially found is Madagascar, followed by central Africa, northern Australia and western Mexico. What all these priority regions have in common is the absence of large protected areas that could serve for the in situ conservation of the plant genetic resources of the crops aforementioned.
Subsequently, it has been proposed that gap analysis should not be based on the whole genus alone, but should also consider the analysis of the priority species as well, the reason being that in larger genera, the bulk of the species that are unlikely to be of immediate potential use might mask the ecogeographic distribution of those species of highest potential value. This can be illustrated by the case of cowpea relatives in sub-Saharan Africa. Moray and Maxted (2012) compared the results of analysing the whole genus of 124 Vigna taxa with the 14 Vigna taxa present in the primary (gp1) and secondary genepools (gp2), those most closely related to cowpea, and, perhaps not surprisingly, found the results were distinct (see figures 41.4 and 41.5). The conclusion was that if you are trying to establish the priority areas for ex situ or in situ conservation, then, as funds are likely to be limiting, the gap analysis should consider the priority taxa alone as well as the whole genus, allowing an informed decision to be made as to where to focus conservation. As noted in chapter 14, a Harlan and de Wet Global Priority Checklist of CWR Taxa (Vincent et al., 2012) is now available for 173 crop genepools, based on a published genepool and taxon group concept (see www.cwrdiversity.org). This will guide those wishing to establish which CWR should be included in gap analysis based on their priority as trait donors for breeding.
 |
|
Figure 41.4: Complementary analysis for all 124 African Vigna taxa. Note: The darker green squares represent the highest priority regions for conservation, while the orange and red squares identify areas of lower priority. |
 |
|
Figure 41.5: Complementary analysis for 14 priority African Vigna taxa (primary and secondary CWR taxa). |
A third option would be to give different weights to different species in the analysis, based on their relative rarity. See Arponen et al. (2005) and Venevsky and Venevskaya (2005) for further discussion of weighted endemism. This approach has yet to be widely applied in the context of genetic resources but is available in the WorldMap software (see internet resources, below). It is also advisable not to ignore the wider potential genepool, which might contain further non-genepool and taxon group-concept priority taxa with useful traits, especially if tertiary genepool taxa have previously been used in breeding.
Assessment of natural diversity
The level of diversity occurring within the target taxon must be defined at the taxonomic, genetic or ecogeographic levels (i.e., how many taxa occur in the circumscribed taxon and what is their ecogeographic pattern of distribution).
Assessment of taxonomic diversity
Assessing taxonomic diversity involves listing the taxa encompassed by the taxonomic circumspection, whether for the entire genus or for genera (as in the case of Triticum aestivum, which has priority species in three genera: Aegilops, Amblyopyrum and Triticum). This is likely to involve identifying the accepted classification for the target taxon by consulting specialist publications and taxon experts, or searching online sources of information. As noted above, the analysis will usually be based on the highest priority taxa in genepool GP1B or GP2 or, if the genepool concept is unavailable, the equivalent taxon group TG1-3. Genepool and taxon group concepts with the included accepted taxa and synonyms are listed in the Harlan and de Wet Global Priority Checklist of CWR Taxa (Vincent et al., 2012) (see www.cwrdiversity.org).
Assessment of genetic diversity
Having established the list of taxa to be included in the gap analysis, the next step would be to collate existing data or generate new data on the inherent genetic diversity within those taxa. However, this might not be realistic because the knowledge about inherent patterns of genetic diversity is often limited and it could be too resource intensive to collate de novo. Consequently, genetically based approaches to conservation assessment, either in terms of “richness” (the total number of genotypes or alleles present regardless of frequency) or “evenness” (the evenness of the frequencies of different alleles or genotypes), can therefore only be applied to the most highly prioritized taxa. However, proxy or surrogate measures of genetic diversity may be applied, and it can be argued that ecogeography can act as an adequate proxy when there is a lack of specific data on genetic diversity. It should be remembered, however, that using any proxy will not be as accurate as using primary data.
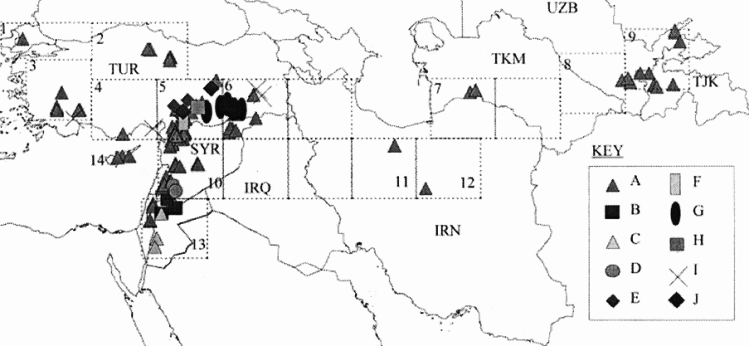
As an example of the use of data on genetic diversity in conservation planning, van Zonneveld et al. (2012) used microsatellite markers to understand the spatial genetic diversity of Annona cherimola throughout the Andean region in Peru, Ecuador and Bolivia, finding places with the highest genetic diversity (southern Ecuador and northern Peru), places that are a priority for in situ conservation (southern Ecuador and northern Peru) and existing gaps in ex situ collections (southern Ecuador). In a classic study, Ferguson et al. (1998) investigated the relationship between ecogeography and genetic diversity in the wild lentil genepool. The distribution and genetic diversity of Lens culinaris subsp. orientalis show that the subspecies is geographically distributed from western Turkey to Tajikistan, but if the genetic diversity is partitioned into 10 clusters, then the bulk of the genetic diversity is focused almost entirely in the western part of the fertile crescent; thus, in this case, ecogeographic data would not be an adequate proxy for genetic diversity as it would indicate ex situ sampling or the establishment of an in situ genetic reserve across the geographic distribution rather than concentrating both in the western Fertile Crescent, as indicated in figure 41.6. Whether genetic diversity is studied or, as commonly occurs, ecogeography is used as a proxy for genetic diversity, an additional assessment will need to be made of the genetic diversity that exists in natural taxa or populations in order to determine if it is well represented by the samples held in genebanks or by populations represented in protected areas or genetic reserves.
 |
|
Figure 41.6: Distribution of Lens culinaris subsp. orientalis divided into 10 clusters of genetic diversity. |
Assessment of ecogeographic diversity
As there is a lack of knowledge of natural patterns of genetic diversity for the vast majority of crop wild relatives, it is often necessary to employ some form of proxy measure such as ecogeographic diversity (merely because of the prohibitive cost of undertaking genetic diversity studies de novo), even if we know that it might not be an adequate proxy of genetic diversity. Assessing ecogeographic diversity involves the collation of secondary information on the ecology and geography of the species under study (see chapter 14; Guarino et al., 2006; Maxted and Guarino, 2003). The collation and analysis of ecogeographic data is discussed in detail in the original version of chapter 14, along with its update, and so will not be reiterated here.
Recently, Parra-Quijano et al. (2012b) extended the concept of ecogeographic analysis by creating and testing an ecogeographic land characterization map for Spain. The map characterized the habitat preferences of plant species and their adaptations to the environment. Subsequently, this map was used for identifying ecogeographic gaps by comparing those categories represented in ex situ facilities with the categories occurring within the potential niche of the species (Parra-Quijano et al., 2011a). During the collection stage, Parra-Quijano et al. (2011a) identified two populations of Lupinus angustifolius, each occurring in different ecogeographic categories and displaying different phenotypes that may be understood as the adaptation response to these ecological characteristics. Using a similar approach, Ramírez-Villegas et al. (2010) performed a principal component analysis with 19 bioclimatic variables. They took the first two components and divided each into 20 different classes to compare the potential coverage of each species with the germplasm coverage and then assigned numerical scores according to the level of ecological representativeness in germplasm facilities.
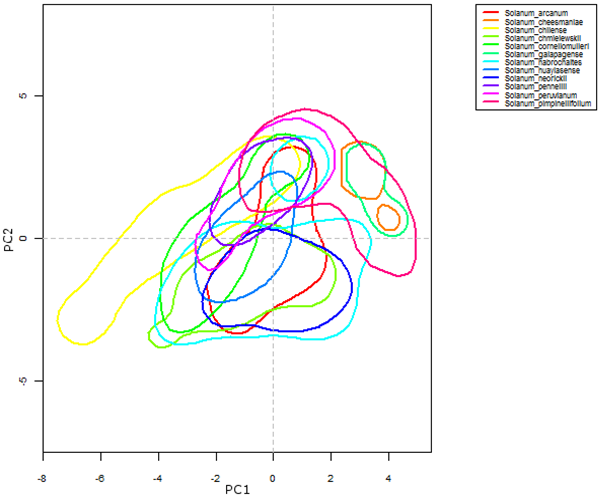
Ecogeographic data is useful for determining the habitat requirements of a particular group of plant species and for understanding sympatric distributions of taxa within a genepool. This latter is illustrated in figure 41.7, where a selection of the wild relatives of cultivated tomato (section Lycopersicoides) is grouped according to their bioclimatic requirements. Solanum galapagense (orange polygon) and S. cheesmaniae (aquamarine polygon) are species occurring specifically in the Galapagos Islands (Ecuador). Their niche characteristics diverge from most of the other species in the section, as reflected in the graph. In the case of S. chilense (yellow polygon), part of its habitat requirement coincides with most of the section but a large part also gravitates towards PC1, suggesting a probable adaptation to ecological conditions that is not seen in the rest of the species.
To obtain the most comprehensive view of a taxon’s ecogeographic diversity, data should be collated from herbaria and genebanks (see chapter 14 for a detailed discussion). Herbarium data can be collected from online sources such as GBIF (http://data.gbif.org), personal visits to herbaria, inventories and literature reviews. While germplasm passport data can be obtained from sources such as GENESYS (www.genesys-pgr.org), which brings together information from the germplasm banks in trust with the members of the Consortium of International Agricultural Research Centers (http://singer.cgiar.org), the European ex situ collections (EURISCO, http://eurisco.ecpgr.org) and the plant germplasm system of the United States (www.ars-grin.gov/npgs/searchgrin.html).
Ecogeography is also useful for “predictive characterization”, proposing inferences based on ecological adaptations and the potential identification of desirable traits for adaptation to abiotic and biotic conditions of interest for breeders (such as resistance to insect pests). A specific application of predictive characterization is focused identification of germplasm strategy (FIGS) (see www.figstraitmine.org). This approach combines the information available on climate and ecogeography, species distribution and the distribution of a particular trait of interest (such as resistance to pests or diseases) in order to create environmental profiles of the habitats in which a given population (genotype) might have evolved. FIGS has been used to successfully identify seven new alleles for resistance to powdery mildew (genePm3) from an initial number of 16,089 wheat accessions (see Bhullar et al., 2009). The use of the FIGS methodology can thus aid breeders in identifying the in situ populations or ex situ accessions of crop landraces or wild relatives most likely to contain the traits of interest (MacKay and Street, 2004).
 |
|
Figure 41.7: Kernel-density plot of the first two dimensions of an assessment based on variables derived from temperature and precipitation, for the section Lycopersicoides, genus Solanum |
Threat assessment
This is an important facet of gap analysis, because it facilitates the relative assessment of conservation priorities: those taxa most threatened will have a higher conservation priority than those less threatened.
Threat assessment is now routinely carried out through the application of the IUCN Red List Categories Version 3.1 (IUCN, 2001). Using associated data from herbaria or genebank accessions as a basis for the assessment, the most likely criteria to be used are criterion B (geographic range in the form of either extent of occurrence or area of occupancy) and D (very small or restricted population). Each year more taxa are included in global, regional and national Red Data lists, but until recently only a relatively small number of plant taxa (and particularly CWR taxa) had been assessed.
Recently, a project funded by the European Community specifically undertook an IUCN Red List assessment for priority European CWR diversity (Bilz et al., 2011; Kell et al., 2012). The CWR species were selected on the basis of being native to Europe, the economic importance of their related crop, their relative relationship to the crop (i.e., ease of trait transfer to the crop) and their inclusion on Annex I of the International Treaty on Plant Genetic Resources for Food and Agriculture (“the Treaty”). The final list of CWR species to be assessed comprised 591 species in 25 crop genepools/groups, 188 of which were endemic to Europe. However, 20 were subsequently assessed as “Not Applicable”, either due to their marginal occurrence in Europe or because they were introduced to Europe after 1500 AD. The status of the remaining 571 species was assessed at two regional levels: geographical Europe (572 species) and the 27 EU member states. At the European level, 313 (55%) were assessed as “Least Concern”, 166 (29%) as “Data Deficient”, 26 (5%) as “Near Threatened”, 22 (4%) as “Vulnerable”, 25 (4%) as “Endangered” and 19 (3%) as “Critically Endangered”. The priority in Europe would therefore be to focus attention on the 66 “Critically Endangered”, “Endangered” and “Vulnerable” species. This, it is hoped, will prove a useful resource for Europe, but the lack of population data is likely to remain a limitation in wider IUCN Red List assessments in other regions.
In the absence of sufficiently detailed population data to undertake an IUCN Red List assessment, a relatively large ecogeographic dataset can be used to make a more tentative threat assessment. Maxted et al. (2005) proposed and applied a technique referred to as taxon vulnerability assessment in situations where there was insufficient data to permit a formal IUCN Red Listing. Vulnerability to a loss of genetic diversity (and even extinction) can be assessed by compounding seven criteria as follows:
1. Rarity is estimated from the total number of herbarium specimens and genebank accessions of each taxon in the ecogeographic database. It is assumed that in most cases this will provide a true indicator of actual occurrence, unless there is evidence to the contrary or the taxon is cultivated or very rare, both of which cases can lead to relative over-sampling by collectors.
2. Distributional range is calculated by taking a given radius around each collecting locality and then merging the resulting circles, providing an approximation of the overall species range using the methodology described by Hijmans and Spooner (2001).
3. Representation in ex situ collections compared to herbarium collections can provide a relative estimate of whether a species’ genepool is sufficiently sampled ex situ.
4. The relative geographic coverage of ex situ collections is compared to the geographic breadth, based on ex situ conserved accessions and herbarium samples.
5. Intra-species coverage of ex situ collections can be used comparatively for species that have multiple infra-specific categories to estimate if each infra-specific taxon is adequately represented in ex situ collections.
6. The usage potential of a species is particularly relevant for the conservation of plant genetic resources, where there will be a particular incentive for conserving those species with the highest use potential. It might also be the case that species with high use potential are more likely to be threatened due to excessive utilization.
7. An assessment of taxon extinction can be estimated by applying Solow’s equation (Solow, 1993) as proposed by Burgman et al. (1995), which uses a combination of collection timing, frequency and specimen numbers.
Each of these seven criteria is assessed for each species, and a numerical score is recorded. These are then summed to establish relative taxon vulnerability.
Assessment of current conservation strategies
The diversity occurring naturally in situ can be compared to the diversity currently conserved in order to assess the efficiency of both in situ and ex situ conservation techniques and so identify the weaknesses (gaps).
Assessment of in situ conservation
Within the context of plant conservation, the definition of in situ conservation provided by the Convention on Biological Diversity (CBD) (1992) includes two distinct conservation techniques: protected area (genetic reserve) conservation for wild species and on-farm conservation in the case of traditional crop varieties, widely known as landraces. Genetic reserve conservation maintains wild species in their natural surroundings, usually within an existing protected area where the site has been selected and is managed and monitored to maintain the genetic diversity of the target taxa.
-
Genetic reserve/protected area assessment: This involves a review of existing protected areas and the species within them that are being actively managed for conservation. As few centralized databases detail which species are being actively conserved in the world’s protected areas, obtaining detailed knowledge of the protected areas in the target area is likely to involve contacting the managers of these areas to ascertain if particular species are present and being actively managed and monitored. It is increasingly possible to use geographic information system (GIS) techniques to compare the protected area spatial layers from the World Database of Protected Areas (http://protectedplanet.net) with species distributional data to predict which priority species are found in which protected areas. But, having matched these datasets, there would still be a need to contact the managers of specific protected areas in order to confirm that the species predicted to be present are indeed present.
-
On-farm conservation assessment: Similarly, the on-farm conservation of landraces requires reviewing existing on-farm conservation projects and the crop species included. The review of on-farm conservation is likely to be simpler than the review of protected areas due to the more limited number of on-farm conservation projects and the relative ease of discovering which crop species are included.
In terms of assessing in situ conservation, it must be admitted that there are so few locations where there is currently any effective in situ conservation of agrobiodiversity, the sites where natural target-taxon diversity is located are almost always likely to be those sites where in situ conservation is recommended.
Assessment of ex situ conservation
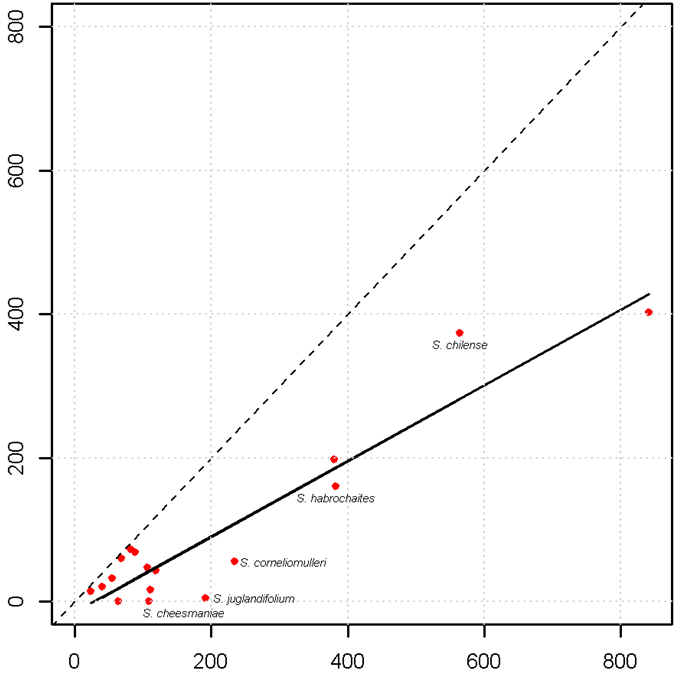
To assess the gross completeness of material conserved ex situ, a comparison should be made between the unique samples recorded from herbaria versus those from genebanks, although these sources of information can become outdated (Bettencourt et al., 1989). Other sources of material that is currently being conserved can be obtained from botanic gardens, as well as from national and international catalogues, databases and web sites. Herbarium data can be collected from online sources (such as GBIF, http://data.gbif.org), personal visits to herbaria, inventories and literature reviews. Germplasm passport data can also be obtained from sources like GENESYS (www.genesys-pgr.org), which brings together information from the germplasm banks in trust with the members of the Consortium of International Agricultural Research Centers (http://singer.cgiar.org), the European ex situ collections (http://eurisco.ecpgr.org) and the plant germplasm system of the United States of America (www.ars-grin.gov/npgs/searchgrin.html). Other initiatives, such as that of the European Native Seed Conservation Network are now in the process of providing additional wild-species genebank accessions associated with botanic gardens through the European Native Seed Conservation Network Database (ENSCOBASE) (http://enscobase.maich.gr). Depending on the extent and scope of the study, local sources could also be considered for obtaining data. As an illustration, figure 41.8 shows the sampling deficiencies for the crop wild relatives of tomato. The bold line in the graph represents the average representativeness of the dataset used, and the dashed line is the total representativeness. Taxa located below the bold line have fewer samples in ex situ holdings compared with the number of samples in herbaria (ex situ sampling deficient). In this case, the “gap” under-collected species are S. habrochaites, S. corneliomulleri, S. juglandifolium and S. cheesmaniae.
 |
|
Figure 41.8: Number of genebank samples of the wild relatives of tomato (Solanum lycopersicum) versus total samples (total is calculated by adding germplasm and herbarium samples) |
When using ecogeographic distribution as a proxy for data on genetic diversity, the ideal ex situ collection would contain samples from geographically diverse sites spread throughout the entire range of distribution of the crop or species. Such a proxy can be calculated using herbarium and genebank collection data, and the circular area statistic (CA) (Hijmans et al., 2001). CA is calculated by assigning a circle of set radius around each collection, and the total area of those circles for all collections is calculated (counting overlapping regions only once). For collections that are geographically highly concentrated, the CA is relatively low compared to a set of collections that are geographically distributed over a wide region (due to greater overlap in clumped collections). This statistic can be used to compare germplasm collections with all collections (germplasm and herbarium collection data) in order to identify how geographically representative the germplasm collection is. Germplasm collections whose geographic distribution is representative should have a CA statistic similar to that of the entire collection. Conversely, germplasm collections where the geographic distribution is poorly represented would have a low CA compared to the entire collection, due to concentrated ex situ collecting in regions representing only a subset of the wider distribution of the species.
Ramírez-Villegas et al. (2010) used a quantitative approach to determine the requirements for ex situ conservation of the genus Phaseolus, assessing three concepts per taxon level: sampling representativeness, geographical and environmental coverage. Sampling representativeness consists of a comparison between the total number of populations sampled and those sampled as genebank accessions. This is referred to as the sampling representativeness score (SRS). Ramírez-Villegas et al. estimated geographical coverage by comparing the potential distribution of the taxon with the circular statistic (CA) within a 50km radius of the germplasm samples, this value is stored as the geographic representativeness score (GRS). The environmental coverage representativeness (or environmental representativeness score, ERS) is estimated by overlapping the whole geographic extent of the taxon with the two principal components of 19 bioclimatic variables and the corresponding germplasm accessions. The final priority score (FPS) is calculated by averaging SRS, GRS and ERS. The lower the value of FPS, the higher the priority for conserving the taxon. Additionally, Ramírez-Villegas et al. (2010) validated the priority for the conservation list produced after applying this methodology by comparing it with the scores given by a recognized expert on Phaseolus (Dr Daniel Debouck), obtaining a high correspondence with his priorities for conservation (reported as rho=0.788).
Reformulation of conservation strategy
An assessment of the effectiveness of current conservation coverage in relation to natural in situ diversity identifies the element of diversity that is under-conserved, i.e. the “gaps” in the existing conservation strategy, and helps refocus the strategy to conserve the maximum diversity and to fill these gaps. The revised priorities are likely to require complementary in situ and ex situ conservation actions to ensure the comprehensive conservation of the target taxon’s genepool.
In situ conservation priorities
Genetic reserve/protected area
The location and establishment of genetic reserves should be based on the gap analysis outlining the most appropriate location for the genetic reserve. Genetic reserves will commonly be established within existing protected areas because (a) these sites already have an associated long-term conservation ethos and are less prone to hasty management changes associated with private land or roadsides where conservation value and sustainability is not a consideration, (b) it is relatively easy to amend the existing site management to facilitate genetic conservation of CWR species and (c) it means that creating new conservation sites can be avoided, thereby also avoiding the possibly prohibitive cost of acquiring land that had not previously been managed for conservation (Maxted et al., 2008c). Therefore, the simplest way forward in economic and political terms is to locate genetic reserves in existing protected areas, such as national parks or heritage sites. This is likely to provide some benefit to local people and so is also likely to gain their support when participatory approaches are employed.
On-farm conservation priorities
Traditional crop or landrace richness can be used to indicate priority sites for in situ conservation for the on-farm conservation of landraces. Areas that have a high concentration of landraces (either of multiple or individual crops) are desired for on-farm conservation projects.
Ex situ conservation priorities
Species and areas within a species range that have been under-sampled in ex situ collections are highlighted as priorities for future collection and subsequent ex situ conservation.
Future challenges/needs/gaps
In the medium term, the understanding of patterns of genetic diversity and their relation to elements of the landscape will allow us to recognize in more detail where the areas of allele richness and uniqueness are, and if there is a correlation with the local environment, thus confirming the validity of using subrogates of diversity such as ecogeographic methods. These analyses could be performed in genepools or genebank collections that have been largely characterized at the molecular level. Increasing interest in (and need for) conserving key plant species should be prioritized using a gap analysis approach, so that the allocation of resources will target the most important species (whether for food, forage, breeding, cultural matters or any other ecosystem service). And finally, there are different types of refined and structured methodologies for gap analysis in the conservation area. Those methodologies based on computer scripts should use open-source coding and should be user friendly, thereby encouraging their use and avoiding the limitations that licensed software might impose to users with restricted budgets.
Two key global initiatives are currently underway and both have at their heart the gap analysis of agrobiodiversity. The Global Crop Diversity Trust has launched the project on Adapting Agriculture to Climate Change (Guarino and Lobell, 2011), which, in part, aims to systematically sample priority CWR taxa and ensure that the germplasm is stored ex situ in the country of origin, the Millennium Seed Bank and the Svalbard Global Seed Vault. Alongside this, during the 13th regular session of the Commission on Genetic Resources for Food and Agriculture, held in 2011, the FAO was requested to elaborate on the means and opportunities for establishing a global network for in situ conservation and on-farm management of plant genetic resources for food and agriculture in coordination with the Treaty, the Global Strategy for Plant Conservation of the CBD and other relevant stakeholders. Both initiatives use as their starting point the Harlan and de Wet Global Priority Checklist of CWR Taxa and ecogeographic datasets for the included taxa to which the basic gap analysis methodology described above is applied. With so much attention currently being paid to the application of the gap analysis methodology, it should come as no surprise if the methodology itself evolves rapidly, so those wishing to undertake gap analysis should keep abreast of these methodological developments.
Conclusion
Although gap analysis is a fairly recent tool for the conservation of plant genetic resources, it is proving to be an effective instrument in the planning of complementary conservation strategies that encompass both in situ and ex situ applications. It has also shown how the study of the passport collection data of herbarium and germplasm accessions, coupled with ecogeographic analyses, can quantify the completeness of current in situ and ex situ conservation actions and identify gaps in conservation diversity at both the taxon and geographic level, which, in turn, helps in the prioritization of future conservation actions.
This basic methodology has been successfully applied to assist the development of national conservation strategies for CWR diversity in the UK (Maxted et al., 2007) and Israel (Barazani et al., 2008), and, at a monographic scale, the African genus Vigna (Maxted et al., 2005), the FAO CWR project (Maxted and Kell, 2009) and the CIAT-IRRI-Bioversity International GapAnalysis project, showing that the methodology is sufficiently robust to yield useful results that can bolster conservation efficiency. If the conservation community is to meet the challenge of the CBD Strategic Plan “Target 13” by 2020, the status of the genetic diversity of crop and livestock agricultural ecosystems and of wild relatives will have to be improved (CBD, 2010) and tools such as the gap analysis methodology described above are likely to prove essential.
Back to list of chapters on collecting
References and further reading
Arponen A, Heikkinen R, Thomas CD, Moilanen A. 2005. The value of biodiversity in reserve selection: Representation, species weighting and benefit functions. Conservation Biology 19: 2009–2014.
Balmford A. 2003. Conservation planning in the real world: South Africa shows the way. Trends in Ecology and Evolution 18:435–438.
Barazani O, Perevolotsky A, Hadas R. 2008. A problem of the rich: Prioritizing local plant genetic resources for ex situ conservation in Israel. Biological Conservation 141: 596–600.
Bettencourt E, Konopka J, Damania AB. 1989. Directory of Crop Germplasm Collections. 1. Food LEGUMES. International Board for Plant Genetic Resources, Rome.
Bhullar NK, Street K, Mackay M, Yahiaoui N, Keller B. 2009. Unlocking wheat genetic resources for the molecular identification of previously undescribed functional alleles at the Pm3 resistance locus. Proceedings of the National Academy of Sciences of the United States of America 106: 9519–9525.
Bilz M, Kell SP, Maxted N, Lansdown RV. 2011. European Red List of Vascular Plants. Publications Office of the European Union, Luxembourg.
Brooks TM, Bakarr MI, Boucher T, Da Fonseca GAB, Hilton-Taylor C, Hoekstra JM. 2004. Coverage provided by the global protected area system: Is it enough? Bioscience 54:1081–1091.
Burgman A, Grimson RC, Ferson S. 1995. Inferring threat from scientific collections. Conservation Biology 9:923–929.
Burley FW. 1988. Monitoring biological diversity for setting priorities in conservation. In: Wilson EO, Peter FM, editors. Biodiversity. National Academy Press, Washington DC. pp. 227–230
CBD. 1992. Convention on Biological Diversity: Text and Annexes. Secretariat of the Convention on Biological Diversity, Montreal.
CBD. 2010. Strategic Plan for Biodiversity 2011–2020, Including Aichi Biodiversity Targets. Secretariat of the Convention on Biological Diversity, Montreal.
Dietz RW, Czech B. 2005. Conservation deficits for the continental United States: An ecosystem gap analysis. Conservation Biology 19:1478–1487.
FAO. 2009. The Second Report on the State of the World’s Plant Genetic Resources for Food and Agriculture. Food and Agriculture Organization of the United Nations, Rome.
Ferguson ME, Ford-Lloyd BV, Robertson LD, Maxted N, Newbury HJ. 1998. Mapping the geographical distribution of genetic variation in the genus Lens for the enhanced conservation of plant genetic diversity. Molecular Ecology 7:1743–1755.
Guarino L, Lobell DB. 2011. A walk on the wild side. Nature Climate Change 1:374–375.
Guarino L, Maxted N, Chiwona EA. 2006. A methodological model for ecogeographic surveys of crops. IPGRI Technical Bulletin No. 9. International Plant Genetic Resources Institute, Rome.
Hijmans R, Spooner D. 2001. Geographic distribution of wild potato species. American Journal of Botany 88:2101–2112.
Hijmans RJ, Cruz M, Rojas E, Guarino L. 2001. DIVA-GIS Manual. Version 1.4. A Geographic Information System for the Management and Analysis of Genetic Resources Data. International Potato Center, Lima, Peru.
IUCN. 2001. IUCN Red List Categories Version 3.1. IUCN Species Survival Commission. International Union for Conservation of Nature and Natural Resources, Gland, Switzerland.
Kell SP, Maxted N, Bilz M. 2012. European crop wild relative threat assessment: Knowledge gained and lessons learnt. In: Maxted N, Dulloo ME, Ford-Lloyd BV, Frese L, Iriondo JM, Pinheiro de Carvalho MAA, editors. Agrobiodiversity Conservation: Securing the Diversity of Crop Wild Relatives and Landraces. CAB International, Wallingford, UK. pp. 218–242.
Lipow SR, Vance-Borland K, St. Clair JB, Henderson J, McCain C. 2004. Gap analysis of conserved genetic resources for forest trees. Conservation Biology 18(2):412–423.
Mackay MC, Street K. 2004. Focused identification of germplasm strategy—FIGS. In: Black CK, Panozzo JF, Rebetzke GJ, editors. Cereals 2004. Proceedings of the 54th Australian Cereal Chemistry Conference and the 11th Wheat Breeders’ Assembly, 21–24 September 2004, Canberra, Australian Capital Territory. Royal Australian Chemical Institute, Melbourne. pp. 138–141.
Margules CR. 1989. Introduction to some Australian developments in conservation evaluation. Biological Conservation 50:1–11.
Margules CR, Pressey RL. 2000. Systematic conservation planning. Nature 405:243–253.
Margules CR, Nicholls AO, Pressey RL. 1988. Selecting networks of reserves to maximise biological diversity. Biological Conservation 43:63–76.
Maxted N, Guarino L. 2003. Planning plant genetic conservation. In: Smith RD, Dickie JB, Linington SH, Pritchard HW, Probert RJ, editors. Seed Conservation: Turning Science into Practice. Royal Botanic Gardens, Kew, UK. pp. 37–78.
Maxted N, Kell SP. 2009. Establishment of a global network for the in situ conservation of crop wild relatives: Status and needs. FAO Consultancy Report. Food and Agriculture Organization of the United Nations, Rome.
Maxted N, Mabuza-Dlamini P, Moss H, Padulosi S, Jarvis A, Guarino L. 2005. An Ecogeographic Survey: African Vigna. Systematic and Ecogeographic Studies of Crop Genepools 10. International Plant Genetic Resources Institute, Rome.
Maxted N, Scholten MA, Codd R, Ford-Lloyd BV. 2007. Creation and use of a national inventory of crop wild relatives. Biological Conservation 140:142–159.
Maxted N, Dulloo E, Ford-Lloyd BV, Iriondo J, Jarvis A. 2008a. Genetic gap analysis: A tool for more effective genetic conservation assessment. Diversity and Distributions 14:1018–1030.
Maxted N, White K, Valkoun J, Konopka J, Hargreaves S. 2008b. Towards a conservation strategy for Aegilops species. Plant Genetic Resources: Characterization and Utilization 6(2):126–141.
Maxted N, Iriondo J, Dulloo E, Lane A. 2008c. Introduction: The integration of PGR conservation with protected area management. In: Iriondo JM, Maxted N, Dulloo E, editors. Plant Genetic Population Management. CAB International, Wallingford, UK. pp. 1–22.
Maxted N, Hargreaves S, Kell SP, Amri A, Street K, Shehadeh A, Piggin J, Konopka J. 2012. Temperate forage and pulse legume genetic gap analysis. Bocconea 24:5–36.
Moray C, Maxted N. 2012. Prioritising conservation of crop resources: A case study of African cowpea (Vigna unguiculata). Conservation Letters, In Press.
Parra-Quijano M, Iriondo JM, Torres E. 2012a. Improving representativeness of gene bank collections through species distribution models, gap analysis and ecogeographic maps. Biodiversity and Conservation 21(1):79–96.
Parra-Quijano M, Iriondo JM, Torres E. 2012b. Ecogeographical land characterization maps as a tool for assessing plant adaptation and their implications in agrobiodiversity studies. Genetic Resources and Crop Evolution 59(2):205–218.
Pressey RL, Nicholls AO. 1989. Efficiency in conservation evaluation: Scoring versus iterative approaches. Biological Conservation 50:199–218.
Pressey RL, Humphries CR, Vane-Wright RI, Williams PH. 1993. Beyond opportunism: Key principles for systematic reserve selection. Trends in Ecology and Evolution 8:124–128.
Ramírez-Villegas J, Khoury C, Jarvis A, Debouck DG, Guarino L. 2010. A gap analysis methodology for collecting crop gene pools: A case study with Phaseolus beans. PLoS ONE 5(10): e13497. doi:10.1371/journal.pone.0013497.
Riemann H, Ezcurra E. 2005. Plant endemism and natural protected areas in the peninsula of Baja California, Mexico. Biological Conservation 122:141–150.
Solow AR. 1993. Inferring extinction from sighting data. Ecology 74:962–964.
van Zonneveld M, Scheldeman X, Escribano P, Viruel MA, van Damme P, Garcia W, Tapia C, Romero J, Sigueñas M, Hormaza JI. 2012. Mapping genetic diversity of cherimoya (Annona cherimola Mill.): Application of spatial analysis for conservation and use of plant genetic resources. PLoS ONE 7(1): e29845. doi:10.1371/journal.pone.0029845.
Venevsky I, Venevskaya S. 2005. Species-energy theory for vascular plants and application of this theory for mapping of national biodiversity hotspots. In: Macroecological tools for Global Change Research. Virtual Institute for Macroecology, Institute for Climate Impact Research, Potsdam. pp. 138–139.
Vincent H, Wiersema J, Dobbie S, Kell SP, Fielder H, Castañeda Alvarez NP, Guarino L, Eastwood R, León B, Maxted N. 2012. A prioritised crop wild relative inventory as a first step to help underpin global food security. Proceedings of the Royal Society B. In preparation.
Whitehouse K. 2011. An ecogeographic and GIS analysis of cereals: Avena, Aegilops, Hordeum, Secale and Triticum. Unpublished Master’s Thesis. University of Birmingham, Birmingham, UK.
Biodiversity and WorldMap: www.nhm.ac.uk/research-curation/research/projects/worldmap/index.html
Botanic Gardens Conservation International (BCGI): www.bgci.org
CIAT-IRRI-Bioversity International GapAnalysis project, ex situ gap analysis results of 13 crop gene pools: http://gisweb.ciat.cgiar.org/gapanalysis
Consortium of International Agricultural Research Centers (SINGER): http://singer.cgiar.org
EURISCO, European ex situ collections: http://eurisco.ecpgr.org
European Native Seed Conservation Network (ENSCOBASE): http://enscobase.maich.gr
FAOSTAT, agricultural statistics and data: www.faostat.fao.org
GBIF, global biodiversity data: http://data.gbif.org
GENESYS, global database of major ex situ genebank holdings: www.genesys-pgr.org
GlobeCover, European Space Agency global land cover map: http://ionia1.esrin.esa.int
Harlan and de Wet Global Priority Checklist of CWR Taxa: www.cwrdiversity.org
Harmonized World Soil Database v 1.2: www.iiasa.ac.at/Research/LUC/External-World-soil-database/HTML
International Panel on Climate Change (IPCC), climate-change forecasts: www.ipcc-data.org/ddc_climscen.html
IUCN Red List, database of extinction threat assessments: www.iucnredlist.org
JSTOR Herbaria: http://plants.jstor.org
STRM 90m Digital Elevation Data: http://srtm.csi.cgiar.org/index.asp
The Plant List, working list of all known plant species: www.theplantlist.org
Tropicos®, herbarium resources, Missouri Botanical Gardens, USA: www.tropicos.org
UNEP WCMC World Database of Protected Areas: www.protectedplanet.net
US Genetic Resources Information Network (GRIN): www.ars-grin.gov/npgs/acc/acc_queries.html
World Database of Protected Areas: http://protectedplanet.net
Worldclim Global Climate Layers, 1km resolution grids of climate and derived bioclimate datasets: www.worldclim.org
Comments
- No comments found
Leave your comments
Post comment as a guest